Vodafone 2012 Annual Report Download - page 17
Download and view the complete annual report
Please find page 17 of the 2012 Vodafone annual report below. You can navigate through the pages in the report by either clicking on the pages listed below, or by using the keyword search tool below to find specific information within the annual report.-
 1
1 -
2
-
3
-
4
-
5
-
6
-
 7
7 -
 8
8 -
 9
9 -
 10
10 -
 11
11 -
 12
12 -
 13
13 -
 14
14 -
 15
15 -
 16
16 -
 17
17 -
 18
18 -
 19
19 -
 20
20 -
 21
21 -
 22
22 -
 23
23 -
 24
24 -
 25
25 -
 26
26 -
 27
27 -
28
-
29
-
30
-
31
-
32
-
33
-
34
-
35
-
36
-
37
-
38
-
39
-
40
-
41
-
42
-
43
-
44
-
45
-
46
-
47
-
48
-
49
-
50
-
51
-
52
-
53
-
54
-
55
-
56
-
57
-
58
-
59
-
60
-
61
-
62
-
63
-
64
-
65
-
66
-
67
-
68
-
69
-
70
-
71
-
72
-
73
-
74
-
75
-
76
-
77
-
78
-
79
-
80
-
81
-
82
-
83
-
84
-
85
-
86
-
87
-
88
-
89
-
90
-
91
-
92
-
93
-
94
-
95
-
96
-
97
-
98
-
99
-
100
-
101
-
102
-
103
-
104
-
105
-
106
-
107
-
108
-
109
-
110
-
111
-
112
-
113
-
114
-
115
-
116
-
117
-
118
-
119
-
120
-
121
-
122
-
123
-
124
-
125
-
126
-
127
-
128
-
129
-
130
-
131
-
132
-
133
-
134
-
135
-
136
-
137
-
138
-
139
-
140
-
141
-
142
-
143
-
144
-
145
-
146
-
147
-
148
-
149
-
150
-
151
-
152
-
153
-
154
-
155
-
156
-
157
-
158
-
159
-
160
-
161
-
162
-
163
-
164
-
165
-
166
-
167
-
168
-
169
-
170
-
171
-
172
-
173
-
174
-
175
-
176
 |
 |

Business review Performance Governance Financials Additional information
15
Vodafone Group Plc
Annual Report 2012
Group adjusted operating prot was
£11.5billion, down 2.4% year-on-year but at
the top of our guidance range of £11.0 billion
– £11.8 billion based on guidance exchange
rates. The decline in adjusted operating prot
was due to the sale of our interest in SFR at the
start of the year; on an organic basis, adjusted
operating prot was up 2.5%*, as a result of the
good performance at VZW.
We recognised £3.5 billion of net gains on the
disposals of our interests in SFR and Polkomtel,
and we recorded impairment charges of
£4.0billion relating to our businesses in Italy,
Spain, Portugal and Greece primarily driven
bylower projected cash ows within business
plans and an increase in discount rates,
resulting from adverse changes in the
economic environment.
Free cash ow was £6.1 billion and within our
guidance range of £6.0 billion – £6.5 billion for
the year. The year-on-year decline reected
the loss of dividends from China Mobile
Limited, the reduction in dividends from SFR,
and the conclusion of our prior year working
capital programme. Capex was up 2.3% at
£6.4billion, as we continued to maintain our
signicant level of investment to support our
network strategy. In addition to our reported
free cash ow we received an income dividend
of US$4.5 billion (£2.9 billion) from VZW.
Adjusted earnings per share was 14.91 pence,
down 11.0% on last year. The decline was driven
by the loss of our share of SFR and Polkomtel
prots, the loss of income from our interests in
China Mobile Limited and SoftBank, and higher
nance charges as the result of our decision to
take advantage of low prevailing interest rates to
x a higher proportion of our debt.
The Board is recommending a nal dividend
per share of 6.47 pence, to give total ordinary
dividends per share of 9.52 pence, up 7.0%
year-on-year. During the year we also paid a
special dividend of 4.0 pence per share, paid
out of the income dividend we received from
VZW. Total dividends per share were therefore
up 51.9%.
Europe
Organic service revenue in Europe was down
1.1%* year-on-year. Excluding the impact of
regulated cuts to mobile termination rates
(‘MTRs’), service revenue grew by 1.4%*. As in
the prior year, we saw a broad divide between
the more stable major markets of northern
Europe, with Germany, the UK and the
Netherlands all growing; and the much weaker
markets of southern Europe, with Italy and
Spain suffering from strong competition and a
very poor macroeconomic environment.
Data revenue growth was strong at 20.2%*,
with smartphone penetration on contract
customers of 44.9%, up 11.5 percentage points
during the year. We have continued our major
commercial push towards integrated voice,
SMS and data tariffs, so that in the nal quarter,
43.2% of consumer contract service revenue
in our major European markets came from
customers on integrated tariffs.
Organic EBITDA was down 4.5%*, and the
EBITDA margin fell 1.5* percentage points.
Thedecline in EBITDA margin was almost
entirely driven by margin erosion in Spain,
where we put through signicant price cuts
during the year. Elsewhere, we beneted from
increased cost efciency.
AMAP
Organic service revenue growth in AMAP was
8.0%*. Our two major businesses, India and
Vodacom, reported growth of 19.5%* and 7.1%*
respectively. In India, pricing showed clear
signs of stabilisation after a prolonged price
war. In South Africa, growth continued to be
strong, despite signicant price cuts on data
tariffs. In Australia, revenue declined sharply
asour network perception continued to suffer
after service issues experienced more than a
year ago.
Organic EBITDA was up 7.8%* with EBITDA
margin down 0.1* percentage points. EBITDA
margins in our two biggest AMAP businesses,
Vodacom and India, increased, but this positive
impact was offset by a signicant decline in the
EBITDA margin in Australia.
Verizon Wireless
Our share of the net income of VZW
represented 42.2% of our Group adjusted
operating prot. VZW enjoyed another very
strong year, with organic service revenue
up7.3%* and EBITDA up 7.9%*. Our share of
protsfrom VZW amounted to £4.9 billion,
up9.3%* year-on-year. In December 2011
VZWannounced the proposed acquisition
of122Advanced Wireless Services spectrum
licenses, covering a population of 259 million,
from SpectrumCo for US$3.6 billion
(£2.3billion).
For a detailed analysis of our nancial
performance for the year, please turn to
page40.
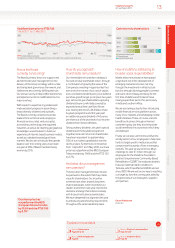
+1.5Group
Data
Emerging markets
+22.2
+13.2
Enterprise +2.2
Service revenue growth 2012* %
Service revenue by type 2012
Fixed: 8% Other: 5%
Messaging:
12%
Data: 15% Voice: 60%