Vodafone 2012 Annual Report Download - page 109
Download and view the complete annual report
Please find page 109 of the 2012 Vodafone annual report below. You can navigate through the pages in the report by either clicking on the pages listed below, or by using the keyword search tool below to find specific information within the annual report.-
 1
1 -
2
-
3
-
4
-
5
-
6
-
7
-
8
-
9
-
10
-
11
-
12
-
13
-
14
-
15
-
16
-
17
-
18
-
19
-
20
-
21
-
22
-
23
-
24
-
25
-
26
-
27
-
28
-
29
-
30
-
31
-
32
-
33
-
34
-
35
-
36
-
37
-
38
-
39
-
40
-
41
-
42
-
43
-
44
-
45
-
46
-
47
-
48
-
49
-
50
-
51
-
52
-
53
-
54
-
55
-
56
-
57
-
58
-
59
-
60
-
61
-
62
-
63
-
64
-
65
-
66
-
67
-
68
-
69
-
70
-
71
-
72
-
73
-
74
-
75
-
76
-
77
-
78
-
79
-
80
-
81
-
82
-
83
-
84
-
85
-
86
-
87
-
88
-
89
-
90
-
91
-
92
-
93
-
94
-
95
-
96
-
97
-
98
-
 99
99 -
 100
100 -
 101
101 -
 102
102 -
 103
103 -
 104
104 -
 105
105 -
 106
106 -
 107
107 -
 108
108 -
 109
109 -
 110
110 -
 111
111 -
 112
112 -
 113
113 -
 114
114 -
 115
115 -
 116
116 -
 117
117 -
 118
118 -
 119
119 -
120
-
121
-
122
-
123
-
124
-
125
-
126
-
127
-
128
-
129
-
130
-
131
-
132
-
133
-
134
-
135
-
136
-
137
-
138
-
139
-
140
-
141
-
142
-
143
-
144
-
145
-
146
-
147
-
148
-
149
-
150
-
151
-
152
-
153
-
154
-
155
-
156
-
157
-
158
-
159
-
160
-
161
-
162
-
163
-
164
-
165
-
166
-
167
-
168
-
169
-
170
-
171
-
172
-
173
-
174
-
175
-
176
 |
 |

Business review Performance Governance Financials Additional information
107
Vodafone Group Plc
Annual Report 2012
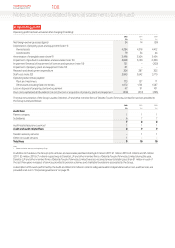
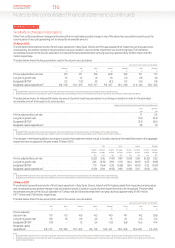
A reconciliation of EBITDA to operating prot is shown below. For a reconciliation of operating prot to prot before taxation, see the consolidated
income statement on page 94.
2012 2011 2010
£m £m £m
EBITDA 14,475 14,670 14,735
Depreciation, amortisation and loss on disposal of xed assets (7,906) (7,967) (8,011)
Share of results in associates 4,963 5,059 4,742
Impairment losses (4,050) (6,150) (2,100)
Other income and expense 3,705 (16) 114
Operating prot 11,187 5,596 9,480
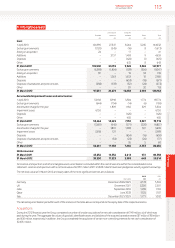
Other
expenditure Depreciation Impairment
Non-current Capital on intangible and loss/
assets1expenditure2assets amortisation (reversal)
£m £m £m £m £m
31 March 2012
Germany 19,151 880 4 1,469 –
Italy 13,978 621 875 783 2,450
Spain 8,069 429 71 626 900
UK 6,430 575 – 880 –
Other Europe 10,146 1,092 313 1,389 700
Europe 57,774 3,597 1,263 5,147 4,050
India 8,431 805 – 1,066 –
Vodacom 6,469 723 – 840 –
Other Africa, Middle East and Asia Pacic 4,735 793 – 771 –
Africa, Middle East and Asia Pacic 19,635 2,321 – 2,677 –
Non-Controlled Interests and Common Functions 760 447 – 35 –
Group 78,169 6,365 1,263 7,859 4,050
31 March 2011
Germany 20,764 824 1,214 1,361 –
Italy 16,645 590 12 732 1,050
Spain 9,596 517 – 641 2,950
UK 6,665 516 – 874 –
Other Europe 11,438 1,230 59 1,406 2,150
Europe 65,108 3,677 1,285 5,014 6,150
India 9,882 870 1,851 973 –
Vodacom 7,382 572 19 1,013 –
Other Africa, Middle East and Asia Pacic 4,797 754 2 793 –
Africa, Middle East and Asia Pacic 22,061 2,196 1,872 2,779 –
Non-Controlled Interests and Common Functions 1,570 346 9 83 –
Group 88,739 6,219 3,166 7,876 6,150
31 March 2010
Germany 20,211 766 18 1,422 –
Italy 17,941 610 60 732 –
Spain 12,746 543 – 638 –
UK 6,977 494 – 963 –
Other Europe 13,883 1,282 228 1,467 (200)
Europe 71,758 3,695 306 5,222 (200)
India 8,665 853 – 848 2,300
Vodacom 7,783 520 – 1,005 –
Other Africa, Middle East and Asia Pacic 5,062 694 – 683 –
Africa, Middle East and Asia Pacic 21,510 2,067 – 2,536 2,300
Non-Controlled Interests and Common Functions 1,632 430 19 152 –
Group 94,900 6,192 325 7,910 2,100
Notes:
1 Comprises goodwill, other intangible assets and property, plant and equipment.
2 Includes additions to property, plant and equipment and computer software, reported within intangible assets.