Vodafone 2012 Annual Report Download - page 108
Download and view the complete annual report
Please find page 108 of the 2012 Vodafone annual report below. You can navigate through the pages in the report by either clicking on the pages listed below, or by using the keyword search tool below to find specific information within the annual report.-
 1
1 -
2
-
3
-
4
-
5
-
6
-
7
-
8
-
9
-
10
-
11
-
12
-
13
-
14
-
15
-
16
-
17
-
18
-
19
-
20
-
21
-
22
-
23
-
24
-
25
-
26
-
27
-
28
-
29
-
30
-
31
-
32
-
33
-
34
-
35
-
36
-
37
-
38
-
39
-
40
-
41
-
42
-
43
-
44
-
45
-
46
-
47
-
48
-
49
-
50
-
51
-
52
-
53
-
54
-
55
-
56
-
57
-
58
-
59
-
60
-
61
-
62
-
63
-
64
-
65
-
66
-
67
-
68
-
69
-
70
-
71
-
72
-
73
-
74
-
75
-
76
-
77
-
78
-
79
-
80
-
81
-
82
-
83
-
84
-
85
-
86
-
87
-
88
-
89
-
90
-
91
-
92
-
93
-
94
-
95
-
96
-
97
-
 98
98 -
 99
99 -
 100
100 -
 101
101 -
 102
102 -
 103
103 -
 104
104 -
 105
105 -
 106
106 -
 107
107 -
 108
108 -
 109
109 -
 110
110 -
 111
111 -
 112
112 -
 113
113 -
 114
114 -
 115
115 -
 116
116 -
 117
117 -
 118
118 -
119
-
120
-
121
-
122
-
123
-
124
-
125
-
126
-
127
-
128
-
129
-
130
-
131
-
132
-
133
-
134
-
135
-
136
-
137
-
138
-
139
-
140
-
141
-
142
-
143
-
144
-
145
-
146
-
147
-
148
-
149
-
150
-
151
-
152
-
153
-
154
-
155
-
156
-
157
-
158
-
159
-
160
-
161
-
162
-
163
-
164
-
165
-
166
-
167
-
168
-
169
-
170
-
171
-
172
-
173
-
174
-
175
-
176
 |
 |

106
Vodafone Group Plc
Annual Report 2012
Notes to the consolidated nancial statements (continued)
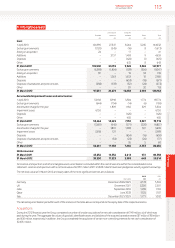
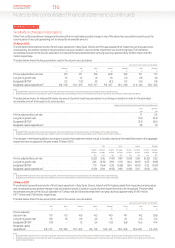
3. Segment analysis
The Group has a single group of related services and products being the supply of communications services and products. Segment information is
provided on the basis of geographic areas, being the basis on which the Group manages its worldwide interests. Revenue is attributed to a country or
region based on the location of the Group company reporting the revenue. Inter-segment sales are charged at arm’s length prices.
Segment Intra-region Regional Inter-region Group
revenue revenue revenue revenue revenue EBITDA1
£m £m £m £m £m £m
31 March 2012
Germany 8,233 (44) 8,189 (1) 8,188 2,965
Italy 5,658 (28) 5,630 (1) 5,629 2,514
Spain 4,763 (54) 4,709 (3) 4,706 1,193
UK 5,397 (37) 5,360 (6) 5,354 1,294
Other Europe 8,352 (59) 8,293 (5) 8,288 2,479
Europe 32,403 (222) 32,181 (16) 32,165 10,445
India 4,265 – 4,265 (6) 4,259 1,122
Vodacom 5,638 – 5,638 (8) 5,630 1,930
Other Africa, Middle East and Asia Pacic 3,965 – 3,965 (23) 3,942 1,063
Africa, Middle East and Asia Pacic 13,868 – 13,868 (37) 13,831 4,115
Non-Controlled Interests and Common Functions 423 – 423 (2) 421 (85)
Group 46,694 (222) 46,472 (55) 46,417 14,475
Verizon Wireless220,187 7,689
31 March 2011
Germany 7,900 (51) 7,849 (2) 7,847 2,952
Italy 5,722 (31) 5,691 (3) 5,688 2,643
Spain 5,133 (62) 5,071 (2) 5,069 1,562
UK 5,271 (50) 5,221 (7) 5,214 1,233
Other Europe 8,253 (70) 8,183 (3) 8,180 2,433
Europe 32,279 (264) 32,015 (17) 31,998 10,823
India 3,855 (1) 3,854 (11) 3,843 985
Vodacom 5,479 – 5,479 (8) 5,471 1,844
Other Africa, Middle East and Asia Pacic 3,971 – 3,971 (27) 3,944 1,170
Africa, Middle East and Asia Pacic 13,305 (1) 13,304 (46) 13,258 3,999
Non-Controlled Interests and Common Functions 659 – 659 (31) 628 (152)
Group 46,243 (265) 45,978 (94) 45,884 14,670
Verizon Wireless218,711 7,313
31 March 2010
Germany 8,008 (41) 7,967 (8) 7,959 3,122
Italy 6,027 (40) 5,987 (2) 5,985 2,843
Spain 5,713 (81) 5,632 (2) 5,630 1,956
UK 5,025 (47) 4,978 (10) 4,968 1,141
Other Europe 8,357 (88) 8,269 (5) 8,264 2,582
Europe 33,130 (297) 32,833 (27) 32,806 11,644
India 3,114 (1) 3,113 (20) 3,093 807
Vodacom 4,450 – 4,450 (7) 4,443 1,528
Other Africa, Middle East and Asia Pacic 3,526 – 3,526 (30) 3,496 977
Africa, Middle East and Asia Pacic 11,090 (1) 11,089 (57) 11,032 3,312
Non-Controlled Interests and Common Functions 667 – 667 (33) 634 (221)
Group 44,887 (298) 44,589 (117) 44,472 14,735
Verizon Wireless217,222 6,689
Notes:
1 The Group’s measure of segment prot, EBITDA, excludes the Group’s share of results in associates. The Group’s share of results in associates, by segment, for the year ended 31 March 2012 is Other Europe £3 million
(2011:£nil; 2010 £nil), Vodacom £nil (2011: £nil; 2010: £(2)million), Other Africa, Middle East and Asia Pacic £36million (2011: £51million; 2010: £56million) and Non-Controlled Interests and Common Functions
£4,924million (2011: £5,008million; 2010: £4,688million).
2 Values shown for Verizon Wireless, which is an associate, are not included in the calculation of Group revenue or EBITDA.