Vodafone 2012 Annual Report Download - page 58
Download and view the complete annual report
Please find page 58 of the 2012 Vodafone annual report below. You can navigate through the pages in the report by either clicking on the pages listed below, or by using the keyword search tool below to find specific information within the annual report.-
 1
1 -
2
-
3
-
4
-
5
-
6
-
7
-
8
-
9
-
10
-
11
-
12
-
13
-
14
-
15
-
16
-
17
-
18
-
19
-
20
-
21
-
22
-
23
-
24
-
25
-
26
-
27
-
28
-
29
-
30
-
31
-
32
-
33
-
34
-
35
-
36
-
37
-
38
-
39
-
40
-
41
-
42
-
43
-
44
-
45
-
46
-
47
-
 48
48 -
 49
49 -
 50
50 -
 51
51 -
 52
52 -
 53
53 -
 54
54 -
 55
55 -
 56
56 -
 57
57 -
 58
58 -
 59
59 -
 60
60 -
 61
61 -
 62
62 -
 63
63 -
 64
64 -
 65
65 -
 66
66 -
 67
67 -
 68
68 -
69
-
70
-
71
-
72
-
73
-
74
-
75
-
76
-
77
-
78
-
79
-
80
-
81
-
82
-
83
-
84
-
85
-
86
-
87
-
88
-
89
-
90
-
91
-
92
-
93
-
94
-
95
-
96
-
97
-
98
-
99
-
100
-
101
-
102
-
103
-
104
-
105
-
106
-
107
-
108
-
109
-
110
-
111
-
112
-
113
-
114
-
115
-
116
-
117
-
118
-
119
-
120
-
121
-
122
-
123
-
124
-
125
-
126
-
127
-
128
-
129
-
130
-
131
-
132
-
133
-
134
-
135
-
136
-
137
-
138
-
139
-
140
-
141
-
142
-
143
-
144
-
145
-
146
-
147
-
148
-
149
-
150
-
151
-
152
-
153
-
154
-
155
-
156
-
157
-
158
-
159
-
160
-
161
-
162
-
163
-
164
-
165
-
166
-
167
-
168
-
169
-
170
-
171
-
172
-
173
-
174
-
175
-
176
 |
 |

56
Vodafone Group Plc
Annual Report 2012
Dividends from associates and to non-controlling
shareholders
Dividends from our associates are generally paid at the discretion of
theboard of directors or shareholders of the individual operating and
holding companies and we have no rights to receive dividends except
where specied within certain of the Group’s shareholders’ agreements.
Similarly, we do not have existing obligations under shareholders’
agreements to pay dividends to non-controlling interest partners of our
subsidiaries or joint ventures, except as specied below.
During the year we received distributions totalling £3.8 billion from
Verizon Wireless, which included a one-off US$4.5 billion (£2.9 billion)
income dividend received in January 2012 and a tax distribution amount
of £965 million (2011: £1,024 million) which is included in dividends
received from associates and investments as shown on page 55. Until
April 2005 Verizon Wireless’ distributions were determined by the terms
of the partnership agreement distribution policy and comprised income
distributions and tax distributions. SinceApril 2005 only tax distributions
have been issued, with the exception of the one-off income dividend
received in January 2012. Following the announcement of Verizon
Wireless’ acquisition of Alltel, certain additional tax distributions were
agreed in addition to the tax distributions required by the partnership
agreement. Current projections forecast that tax distributions will cover
the United States tax liabilities arising from our partnership interest in
Verizon Wireless.
Under the terms of the partnership agreement the Verizon Wireless
board has no obligation to effect additional distributions above the level
of the tax distributions. However, the Verizon Wireless board has agreed
that it will review distributions from Verizon Wireless on a regular basis.
When considering whether distributions will be made each year, the
Verizon Wireless board will take into account its debt position, the
relationship between debt levels and maturities, and overall market
conditions in the context of the ve year business plan.
In June 2011 we sold our entire 44% interest in SFR and received a
naldividend from SFR of €200 million (£178 million) (2011: dividend
received of £373 million). Future cash ows will be reduced by the loss
of dividends from SFR.
Verizon Communications Inc. has an indirect 23.1% shareholding in
Vodafone Italy and under the shareholders’ agreement the shareholders
have agreed to take steps to cause Vodafone Italy to pay dividends at
least annually, provided that such dividends will not impair the nancial
condition or prospects of Vodafone Italy including, without limitation,
itscredit standing. During the 2012 nancial year Vodafone Italy
paiddividends net of withholding tax totalling €289 million (2011:
€325million) to Verizon Communications Inc.
Acquisitions and disposals
We received a net £4,872 million (2011: invested £183 million), net of
cash and cash equivalents disposed and acquired, from acquisition and
disposal activities during the year.
On 16 June 2011 we sold our entire 44% interest in SFR to Vivendi for
acash consideration of €7.75 billion (£6.8 billion) before tax and
transaction costs and received a nal dividend from SFR of €200 million
(£178 million). Vodafone and SFR also entered into a partner market
agreement which will maintain their commercial cooperation.
On 1 July 2011 we acquired an additional 22% stake in Vodafone
IndiaLimited (‘VIL’) from the Essar Group for a cash consideration of
US$4.2billion (£2.6 billion) including withholding tax.
On 9 November 2011 we sold our entire 24.4% interest in Polkomtel
inPoland for cash consideration of approximately €918 million
(£784million) before tax and transaction costs.
On 23 April 2012 we announced a recommended cash offer to acquire
the entire issued ordinary share capital of Cable & Wireless Worldwide
plc, at a value of approximately £1,045 million. For further details refer
tonote 33 to the consolidated nancial statements.
Treasury shares
The Companies Act 2006 permits companies to purchase their own
shares out of distributable reserves and to hold shares in treasury. While
held in treasury, no voting rights or pre-emption rights accrue and no
dividends are paid in respect of treasury shares. Treasury shares may be
sold for cash, transferred (in certain circumstances) for the purposes of
an employee share scheme or cancelled. If treasury shares are sold,
such sales are deemed to be a new issue of shares and will accordingly
count towards the 5% of share capital which the Company is permitted
to issue on a non pre-emptive basis in any one year as approved by its
shareholders at the AGM. The proceeds of any sale of treasury shares up
to the amount of the original purchase price, calculated on a weighted
average price method, is attributed to distributable prots which would
not occur in the case of the sale of non-treasury shares. Any excess
above the original purchase price must be transferred to the share
premium account.
Following the disposal of our 3.2% interest in China Mobile Limited
on10 September 2010, we initiated a £2.8 billion share buyback
programme under the authority granted by our shareholders at the
2010 AGM which was completed in June 2011. Under this programme
the Group purchased a total of 1,631,662,645 shares at an average price
per share, including transaction costs, of 171.60 pence.
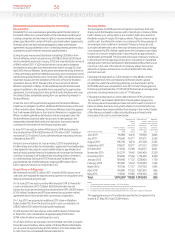
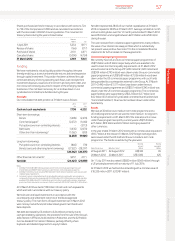
Following the disposal of our entire 44% interest in SFR to Vivendi on
16June 2011, we initiated a £4.0 billion share buyback programme.
TheGroup placed irrevocable purchase instructions with a number of
banks to enable the banks to buy back shares on our behalf when we
may otherwise have been prohibited from buying in the market. Details
of the shares purchased to date, including those purchased under
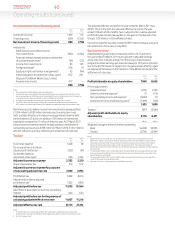
irrevocable instructions, are shown below:
Date of share purchase
Number of shares
purchased1
’000
Average price
paid per
share
inclusive of
transaction
costs
Pence
Total number of
shares
purchased
under share
repurchase
programme2
’000
Maximum
value of shares
that may yet be
purchased
under the
programme3
£m
June 2011 95,908 164.15 95,908 3,843
July 2011 178,643 163.77 274,551 3,550
August 2011 196,798 165.14 471,349 3,225
September 2011 199,672 162.77 671,021 2,900
October 2011 173,100 172.69 844,121 2,601
November 2011 201,279 174.42 1,045,400 2,250
December 2011 125,000 175.60 1,170,400 2,030
January 2012 158,400 177.22 1,328,800 1,750
February 2012 181,200 174.42 1,510,000 1,434
March 2012 197,700 171.37 1,707,700 1,095
April 2012 149,800 172.63 1,857,500 836
May 2012 117,000 170.86 1,974,500 636
Total 1,974,5004170.35 1,974,500 636
Notes:
1 The nominal value of shares purchased is 113⁄7 US cents each.
2 No shares were purchased outside the publicly announced share buyback programme.
3 In accordance with shareholder authority granted at the 2011 AGM.
4 The total number of shares purchased represents 4.0% of our issued share capital at 21 May 2012.
The aggregate amount of consideration paid by the Company for the
shares at 21 May 2012 was £3,364 million.
Financial position and resources (continued)