Vodafone 2012 Annual Report Download - page 132
Download and view the complete annual report
Please find page 132 of the 2012 Vodafone annual report below. You can navigate through the pages in the report by either clicking on the pages listed below, or by using the keyword search tool below to find specific information within the annual report.-
 1
1 -
2
-
3
-
4
-
5
-
6
-
7
-
8
-
9
-
10
-
11
-
12
-
13
-
14
-
15
-
16
-
17
-
18
-
19
-
20
-
21
-
22
-
23
-
24
-
25
-
26
-
27
-
28
-
29
-
30
-
31
-
32
-
33
-
34
-
35
-
36
-
37
-
38
-
39
-
40
-
41
-
42
-
43
-
44
-
45
-
46
-
47
-
48
-
49
-
50
-
51
-
52
-
53
-
54
-
55
-
56
-
57
-
58
-
59
-
60
-
61
-
62
-
63
-
64
-
65
-
66
-
67
-
68
-
69
-
70
-
71
-
72
-
73
-
74
-
75
-
76
-
77
-
78
-
79
-
80
-
81
-
82
-
83
-
84
-
85
-
86
-
87
-
88
-
89
-
90
-
91
-
92
-
93
-
94
-
95
-
96
-
97
-
98
-
99
-
100
-
101
-
102
-
103
-
104
-
105
-
106
-
107
-
108
-
109
-
110
-
111
-
112
-
113
-
114
-
115
-
116
-
117
-
118
-
119
-
120
-
121
-
 122
122 -
 123
123 -
 124
124 -
 125
125 -
 126
126 -
 127
127 -
 128
128 -
 129
129 -
 130
130 -
 131
131 -
 132
132 -
 133
133 -
 134
134 -
 135
135 -
 136
136 -
 137
137 -
 138
138 -
 139
139 -
 140
140 -
 141
141 -
 142
142 -
143
-
144
-
145
-
146
-
147
-
148
-
149
-
150
-
151
-
152
-
153
-
154
-
155
-
156
-
157
-
158
-
159
-
160
-
161
-
162
-
163
-
164
-
165
-
166
-
167
-
168
-
169
-
170
-
171
-
172
-
173
-
174
-
175
-
176
 |
 |

130
Vodafone Group Plc
Annual Report 2012
Notes to the consolidated nancial statements (continued)
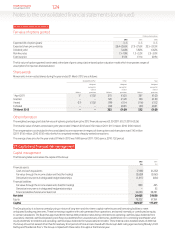
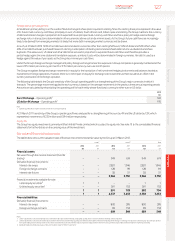
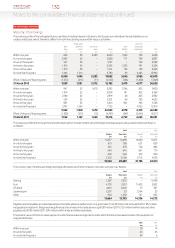
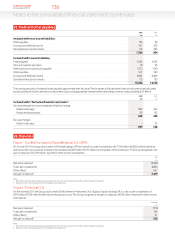
Maturity of borrowings
The maturity prole of the anticipated future cash ows including interest in relation to the Group’s non-derivative nancial liabilities on an
undiscounted basis, which, therefore, differs from both the carrying value and fair value, is as follows:
Redeemable Loans in fair
Bank preference Commercial Other value hedge
loans shares paper Bonds liabilities relationships Total
£m £m £m £m £m £m £m
Within one year 684 56 2,283 2,000 1,044 199 6,266
In one to two years 2,983 56 – 2,828 771 199 6,837
In two to three years 567 56 – 3,197 – 762 4,582
In three to four years 1,316 56 – 3,536 1,235 191 6,334
In four to ve years 1,574 56 – 1,541 726 169 4,066
In more than ve years 1,466 1,214 – 6,780 69 4,465 13,994
8,590 1,494 2,283 19,882 3,845 5,985 42,079
Effect of discount/nancing rates (1,331) (213) (11) (4,130) (366) (1,408) (7,459)
31 March 2012 7,259 1,281 2,272 15,752 3,479 4,577 34,620
Within one year 947 52 1,670 3,292 3,766 203 9,930
In one to two years 1,914 52 – 2,009 191 203 4,369
In two to three years 2,748 52 – 2,919 60 203 5,982
In three to four years 529 52 – 3,251 60 763 4,655
In four to ve years 987 52 – 3,613 901 195 5,748
In more than ve years 2,197 1,240 – 7,725 – 4,752 15,914
9,322 1,500 1,670 22,809 4,978 6,319 46,598
Effect of discount/nancing rates (1,380) (331) (10) (4,293) (249) (2,054) (8,317)
31 March 2011 7,942 1,169 1,660 18,516 4,729 4,265 38,281
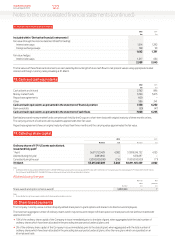
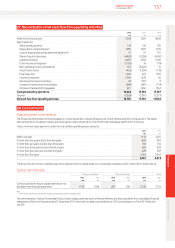
The maturity prole of the Group’s nancial derivatives (which include interest rate and foreign exchange swaps), using undiscounted cash ows, is
asfollows:
2012 2011
Payable Receivable Payable Receivable
£m £m £m £m
Within one year 14,357 14,498 14,840 15,051
In one to two years 675 786 631 829
In two to three years 561 678 724 882
In three to four years 540 641 667 770
In four to ve years 402 520 619 690
In more than ve years 2,533 3,566 3,715 4,592
19,068 20,689 21,196 22,814
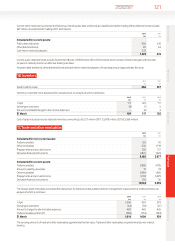
The currency split of the Group’s foreign exchange derivatives, all of which mature in less than one year, is as follows:
2012 2011
Payable Receivable Payable Receivable
£m £m £m £m
Sterling 1,287 7,070 – 10,198
Euro 4,793 2,613 11,422 2,832
US dollar 4,415 2,445 13 387
Japanese yen 2,207 23 2,164 23
Other 962 1,552 727 832
13,664 13,703 14,326 14,272
Payables and receivables are stated separately in the table above as settlement is on a gross basis. The £39million net receivable (2011: £54million
net payable) in relation to foreign exchange nancial instruments in the table above is split £89million (2011: £153million) within trade and other
payables and £128million (2011: £99million) within trade and other receivables.
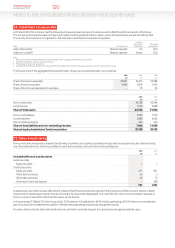
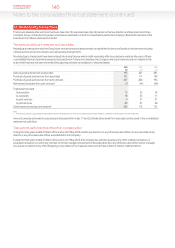
The present value of minimum lease payments under nance lease arrangements under which the Group has leased certain of its equipment is
analysed as follows:
2012 2011
£m £m
Within one year 18 14
In two to ve years 34 45
In more than ve years 34 6
22. Borrowings (continued)