Vodafone 2012 Annual Report Download - page 49
Download and view the complete annual report
Please find page 49 of the 2012 Vodafone annual report below. You can navigate through the pages in the report by either clicking on the pages listed below, or by using the keyword search tool below to find specific information within the annual report.-
 1
1 -
2
-
3
-
4
-
5
-
6
-
7
-
8
-
9
-
10
-
11
-
12
-
13
-
14
-
15
-
16
-
17
-
18
-
19
-
20
-
21
-
22
-
23
-
24
-
25
-
26
-
27
-
28
-
29
-
30
-
31
-
32
-
33
-
34
-
35
-
36
-
37
-
38
-
 39
39 -
 40
40 -
 41
41 -
 42
42 -
 43
43 -
 44
44 -
 45
45 -
 46
46 -
 47
47 -
 48
48 -
 49
49 -
 50
50 -
 51
51 -
 52
52 -
 53
53 -
 54
54 -
 55
55 -
 56
56 -
 57
57 -
 58
58 -
 59
59 -
60
-
61
-
62
-
63
-
64
-
65
-
66
-
67
-
68
-
69
-
70
-
71
-
72
-
73
-
74
-
75
-
76
-
77
-
78
-
79
-
80
-
81
-
82
-
83
-
84
-
85
-
86
-
87
-
88
-
89
-
90
-
91
-
92
-
93
-
94
-
95
-
96
-
97
-
98
-
99
-
100
-
101
-
102
-
103
-
104
-
105
-
106
-
107
-
108
-
109
-
110
-
111
-
112
-
113
-
114
-
115
-
116
-
117
-
118
-
119
-
120
-
121
-
122
-
123
-
124
-
125
-
126
-
127
-
128
-
129
-
130
-
131
-
132
-
133
-
134
-
135
-
136
-
137
-
138
-
139
-
140
-
141
-
142
-
143
-
144
-
145
-
146
-
147
-
148
-
149
-
150
-
151
-
152
-
153
-
154
-
155
-
156
-
157
-
158
-
159
-
160
-
161
-
162
-
163
-
164
-
165
-
166
-
167
-
168
-
169
-
170
-
171
-
172
-
173
-
174
-
175
-
176
 |
 |

Business review Performance Governance Financials Additional information
47
Vodafone Group Plc
Annual Report 2012
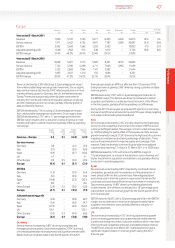
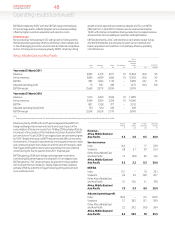
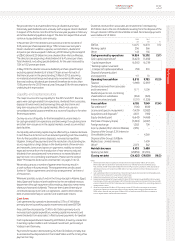
Europe
Germany
£m
Italy
£m
Spain
£m
UK
£m
Other
£m
Eliminations
£m
Europe
£m
% change
£m Organic
Year ended 31 March 2011
Revenue 7,900 5,722 5,133 5,271 8,253 (264) 32,015 (2.5) 0.6
Service revenue 7,471 5,432 4,735 4,931 7,787 (259) 30,097 (3.4) (0.4)
EBITDA 2,952 2,643 1,562 1,233 2,433 – 10,823 (7.1) (3.7)
Adjusted operating prot 1,548 1,903 915 348 1,012 – 5,726 (9.8) (6.1)
EBITDA margin 37.4% 46.2% 30.4% 23.4% 29.5% 33.8%
Year ended 31 March 2010
Revenue 8,008 6,027 5,713 5,025 8,357 (297) 32,833
Service revenue 7,722 5,780 5,298 4,711 7,943 (295) 31,159
EBITDA 3,122 2,843 1,956 1,141 2,582 – 11,644
Adjusted operating prot 1,695 2,107 1,310 155 1,084 – 6,351
EBITDA margin 39.0% 47.2% 34.2% 22.7% 30.9% 35.5%
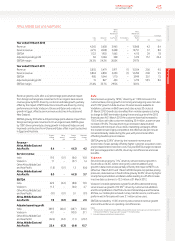
Revenue declined by 2.5% reecting a 3.2 percentage point impact
from unfavourable foreign exchange rate movements. On an organic
basis service revenue declined by 0.4%* reecting reductions in most
markets offset by growth in Germany, the UK, the Netherlands and
Turkey. The decline was primarily driven by lower voice revenue
resulting from continued market and regulatory pressure on pricing
andthe challenging economic climate, partially offset by growth in
dataand xed line revenue.
EBITDA decreased by 7.1% including a 3.5 percentage point impact
fromunfavourable exchange rate movements. On an organic basis
EBITDA decreased by 3.7%*, with a 1.7 percentage point decline in
EBITDA margin resulting from a reduction in service revenue in most
markets and higher customer investment, partially offset by operating
cost savings.
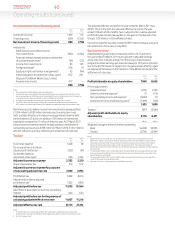
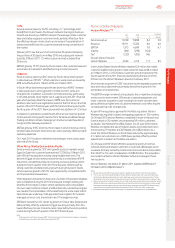
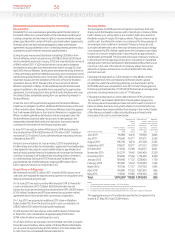
Organic
change
%
M&A
activity
pps
Foreign
exchange
pps
Reported
change
%
Revenue – Europe 0.6 0.1 (3.2) (2.5)
Service revenue
Germany 0.8 – (4.1) (3.3)
Italy (2.1) – (3.9) (6.0)
Spain (6.9) – (3.7) (10.6)
UK 4.7 – – 4.7
Other Europe 0.5 0.5 (3.0) (2.0)
Europe (0.4) 0.1 (3.1) (3.4)
EBITDA
Germany (1.5) – (3.9) (5.4)
Italy (3.1) – (3.9) (7.0)
Spain (16.8) – (3.3) (20.1)
UK 8.0 – – 8.0
Other Europe (2.4) 0.2 (3.6) (5.8)
Europe (3.7) 0.1 (3.5) (7.1)
Adjusted operating prot
Germany (4.9) – (3.8) (8.7)
Italy (5.9) – (3.8) (9.7)
Spain (27.3) – (2.9) (30.2)
UK 125.1 – – 125.1
Other Europe (2.0) 0.3 (4.9) (6.6)
Europe (6.1) 0.1 (3.8) (9.8)
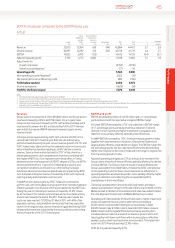
Germany
Service revenue increased by 0.8%* driven by strong data and
messaging revenue growth. Data revenue grew by 27.9%* as a result
ofincreased penetration of smartphones and Superat Internet tariffs.
Mobile revenue remained stable in the fourth quarter of the 2011
nancial year despite anMTR cut effective from 1 December 2010.
Enterprise revenue grew by 3.6%* driven by strong customer and data
revenuegrowth.
EBITDA declined by 1.5%*, with a 1.6 percentage point reduction in
theEBITDA margin. This decline was driven by increased customer
acquisition and retention, contributed to by the launch of the iPhone
inthe third quarter, partially offset by operating cost efciencies.
During the 2011 nancial year we acquired LTE spectrum in Germany
and launched LTE services towards the end of the year, initially targeting
rural areas underserved by xed broadband.
Italy
Service revenue declined by 2.1%* primarily driven by the challenging
economic and competitive environment, the impact of MTR cuts and
customer tariff optimisation. The average contract customer base grew
by 12.6% enabling the partial offset of these pressures. Datarevenue
growth remained strong at 21.5%* driven by the high level of customers
migrating to smartphones and taking advantage of data plans. There
was continued investment to improve quality and coverage of the
network. Fixed line revenue continued to grow with the broadband
customer base reaching 1.7 million at 31 March 2011 on a100% basis.
EBITDA decreased by 3.1%*, with a fall in the EBITDA margin of
1.0percentage point, as a result of the decline in service revenue and
higher investment in acquisition and retention costs partially offset by
areduction in operating expenses.
Spain
Service revenue declined by 6.9%* impacted by continued intense
competition, general economic weakness and the penetration of
lowerpriced tariffs into the customer base. New integrated plans
wereintroduced in the third quarter in response to the demand for
combined voice and data tariffs driven by the increase in smartphones.
Data revenue grew by 14.8%* driven by mobile broadband and
mobileinternet. One-off items contributed to a 1.8* percentage point
improvement to service revenue growth for the fourth quarter of the
2011 nancial year.
EBITDA declined 16.8%*, with a 3.8 percentage point fall in the EBITDA
margin, due to lower service revenue and proportionately higher
acquisition and retention costs, partially offset by a reduction in
operating expenses.
UK
Service revenue increased by 4.7%* driven by data revenue growth
dueto increasing penetration of smartphones and mobile internet
bundles and strong net contract customer additions, which more than
offset continued competitive pressures and weaker prepaid revenue.
The MTR cuts announced in March 2011 were expected to have a
signicant negative impact on revenue growth during the 2012
nancialyear.