Vodafone 2012 Annual Report Download - page 51
Download and view the complete annual report
Please find page 51 of the 2012 Vodafone annual report below. You can navigate through the pages in the report by either clicking on the pages listed below, or by using the keyword search tool below to find specific information within the annual report.-
 1
1 -
2
-
3
-
4
-
5
-
6
-
7
-
8
-
9
-
10
-
11
-
12
-
13
-
14
-
15
-
16
-
17
-
18
-
19
-
20
-
21
-
22
-
23
-
24
-
25
-
26
-
27
-
28
-
29
-
30
-
31
-
32
-
33
-
34
-
35
-
36
-
37
-
38
-
39
-
40
-
 41
41 -
 42
42 -
 43
43 -
 44
44 -
 45
45 -
 46
46 -
 47
47 -
 48
48 -
 49
49 -
 50
50 -
 51
51 -
 52
52 -
 53
53 -
 54
54 -
 55
55 -
 56
56 -
 57
57 -
 58
58 -
 59
59 -
 60
60 -
 61
61 -
62
-
63
-
64
-
65
-
66
-
67
-
68
-
69
-
70
-
71
-
72
-
73
-
74
-
75
-
76
-
77
-
78
-
79
-
80
-
81
-
82
-
83
-
84
-
85
-
86
-
87
-
88
-
89
-
90
-
91
-
92
-
93
-
94
-
95
-
96
-
97
-
98
-
99
-
100
-
101
-
102
-
103
-
104
-
105
-
106
-
107
-
108
-
109
-
110
-
111
-
112
-
113
-
114
-
115
-
116
-
117
-
118
-
119
-
120
-
121
-
122
-
123
-
124
-
125
-
126
-
127
-
128
-
129
-
130
-
131
-
132
-
133
-
134
-
135
-
136
-
137
-
138
-
139
-
140
-
141
-
142
-
143
-
144
-
145
-
146
-
147
-
148
-
149
-
150
-
151
-
152
-
153
-
154
-
155
-
156
-
157
-
158
-
159
-
160
-
161
-
162
-
163
-
164
-
165
-
166
-
167
-
168
-
169
-
170
-
171
-
172
-
173
-
174
-
175
-
176
 |
 |

Business review Performance Governance Financials Additional information
49
Vodafone Group Plc
Annual Report 2012
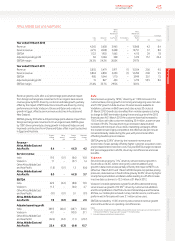
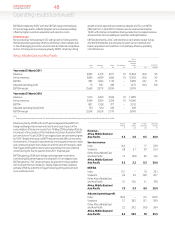
India
Service revenue grew by 16.2%* including a 1.7* percentage point
benet from Indus Towers, the Group’s network sharing joint venture.
Growth was driven by a 39.0% increase in the average mobile customer
base and stable usage per customer trends, partially offset by a fall in
the effective rate per minute due to an increase in the penetration of
lower priced tariffs into the customer base and strong competition in
the market.
February 2011 saw the launch of commercial 3G services following
thepurchase of 3G spectrum in May 2010 and subsequent network
build. By 31 March 2011 1.5 million customers had activated their
3Gaccess.
EBITDA grew by 15.1%* driven by the increase in the customer base and
economies of scale which absorbed pricing and cost pressures.
Vodacom
Service revenue grew by 5.8%* driven by South Africa where growth
indata revenue of 35.9%* 1 offset a decline in voice revenue caused by
MTR cuts effective from 1 March 2010 and 1 March 2011.
In South Africa data revenue growth was driven by a 48.9%* increase
indata usage due to strong growth in mobile connect cards and
smartphones. In addition, successful commercial activity, particularly
inoff-peak periods, drove higher voice usage during the 2011 nancial
year which partially offset the impact of MTR cuts. Net customer
additions returned to pre-registration levels for the rst time in the third
quarter of the 2011 nancial year, with the trend continuing during the
fourth quarter of the 2011 nancial year with net additions of 1.2 million.
In Vodacom’s operations outside South Africa service revenue growth
continued with strong performances from Tanzania and Mozambique.
Trading conditions remain challenging in the Democratic Republic of
Congo and the Gateway operations.
EBITDA grew by 4.9%* driven by the increase in service revenue, strong
handset sales and lower interconnection costs, partially offset by higher
operating expenses.
On 1 April 2011 Vodacom refreshed its branding to more closely align
with that of the Group.
Other Africa, Middle East and Asia Pacic
Service revenue grew by 7.2%* with growth across all markets except
Egypt. In Qatar the customer base reached 757,000 by 31 March 2011,
with 45% of the population actively using Vodafone services. The
decline in Egypt service revenue was driven by a combination of MTR
reductions, competitive pressure on pricing and socio-political unrest
during the fourth quarter of the 2011 nancial year, offset in part by
strong customer and data revenue growth during the year. In Ghana
service revenue growth of 21.0%* was supported by competitive tariffs
and improved brand awareness.
VHA integration remained on track and a number of important initiatives
were completed during the 2011 nancial year to begin realising the
benets of the merger. Contact centre operations were consolidated
into two major centres in Hobart and Mumbai India, substantial progress
was made in the consolidation of the retail footprint, and a major ret of
retail stores was underway. VHA appointed new suppliers for network
managed services, core, transmission and IT managed services.
EBITDA increased by 5.1%* driven by growth in Ghana, New Zealand and
Qatar partially offset by a decline in Egypt resulting primarily fromthe
lower effective price per minute but also impacted by the socio-political
unrest during the fourth quarter of the 2011 nancial year.
Note:
1 Data revenue in South Africa grew by 41.8%*. Excluding the impact of reclassications between messaging
and data revenue during the year, data revenue grew by 35.9%*.
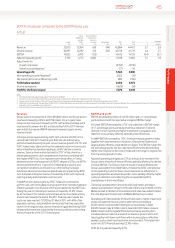
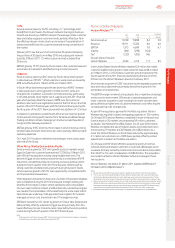
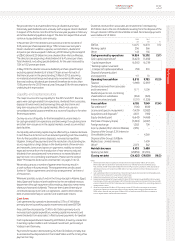
Non-Controlled Interests
Verizon Wireless2 3 4
2011
£m
2010
£m
% change
£ Organic
Service revenue 17,238 15,898 8.4 5.8
Revenue 18,711 17,222 8.6 6.0
EBITDA 7,313 6,689 9.3 6.7
Interest (261) (298) (12.4)
Tax3(235) (205) 14.6
Group’s share of result in
Verizon Wireless 4,569 4,112 11.1 8.5
In the United States Verizon Wireless reported 2.6 million net mobile
customer additions bringing its mobile customer base to 88.4million
at31 March 2011, a 3.1% increase. Customer growth improved in the
fourth quarter of the 2011 nancial year following the launch of the
iPhone 4 on the Verizon Wireless network in February 2011.
Service revenue growth of 5.8%* was driven by the expanding customer
base and robust data revenue primarily derived from growth in the
penetration of smartphones.
The EBITDA margin remained strong despite the competitive challenges
and economic environment. Efciencies in operating expenses and
lower customer acquisition costs resulting from lower volumes were
partly offset by a higher level of customer retention costs reecting the
increased demand for smartphones.
As part of the regulatory approval for the Alltel acquisition, Verizon
Wireless was required to divest overlapping properties in 105 markets.
On 26 April 2010 Verizon Wireless completed the sale of network and
licence assets in 26 markets, encompassing 0.9 million customers,
toAtlantic Tele-Network for US$0.2 billion. On 22 June 2010 Verizon
Wireless completed the sale of network assets and mobile licences in
the remaining 79 markets to AT&T Mobility for US$2.4 billion. As a
resultthe Verizon Wireless customer base reduced by approximately
2.1million net customers on a 100% basis, partially offset by certain
adjustments in relation to the Alltel acquisition.
On 23 August 2010 Verizon Wireless acquired a spectrum licence,
network assets and related customers in southwest Mississippi and in
Louisiana, formerly owned by Centennial Communications Corporation,
from AT&T Inc. for cash consideration of US$0.2 billion. This acquisition
was made to enhance Verizon Wireless’ network coverage in these
twolocations.
Verizon Wireless’ net debt at 31 March 2011 totalled US$9.8 billion5
(31March 2010: US$22.6 billion5).
Notes:
2 All amounts represent the Group’s share based on its 45% equity interest, unless otherwise stated.
3 The Group’s share of the tax attributable to Verizon Wireless relates only to the corporate entities held
bythe Verizon Wireless partnership and certain state taxes which are levied on the partnership. The tax
attributable to the Group’s share of the partnership’s pre-tax prot is included within the Group tax charge.
4 Organic growth rates include the impact of a non-cash revenue adjustment which was recorded by Verizon
Wireless to defer previously recognised data revenue that will be earned and recognised in future periods.
Excluding this the equivalent organic growth rates for service revenue, revenue, EBITDA and the Group’s
share of result in Verizon Wireless would have been 6.4%*, 6.6%*, 8.2%* and 10.8%* respectively.
5 Net debt excludes pending credit card receipts. Comparatives are presented on a comparable basis.