Vodafone 2012 Annual Report Download - page 50
Download and view the complete annual report
Please find page 50 of the 2012 Vodafone annual report below. You can navigate through the pages in the report by either clicking on the pages listed below, or by using the keyword search tool below to find specific information within the annual report.-
 1
1 -
2
-
3
-
4
-
5
-
6
-
7
-
8
-
9
-
10
-
11
-
12
-
13
-
14
-
15
-
16
-
17
-
18
-
19
-
20
-
21
-
22
-
23
-
24
-
25
-
26
-
27
-
28
-
29
-
30
-
31
-
32
-
33
-
34
-
35
-
36
-
37
-
38
-
39
-
 40
40 -
 41
41 -
 42
42 -
 43
43 -
 44
44 -
 45
45 -
 46
46 -
 47
47 -
 48
48 -
 49
49 -
 50
50 -
 51
51 -
 52
52 -
 53
53 -
 54
54 -
 55
55 -
 56
56 -
 57
57 -
 58
58 -
 59
59 -
 60
60 -
61
-
62
-
63
-
64
-
65
-
66
-
67
-
68
-
69
-
70
-
71
-
72
-
73
-
74
-
75
-
76
-
77
-
78
-
79
-
80
-
81
-
82
-
83
-
84
-
85
-
86
-
87
-
88
-
89
-
90
-
91
-
92
-
93
-
94
-
95
-
96
-
97
-
98
-
99
-
100
-
101
-
102
-
103
-
104
-
105
-
106
-
107
-
108
-
109
-
110
-
111
-
112
-
113
-
114
-
115
-
116
-
117
-
118
-
119
-
120
-
121
-
122
-
123
-
124
-
125
-
126
-
127
-
128
-
129
-
130
-
131
-
132
-
133
-
134
-
135
-
136
-
137
-
138
-
139
-
140
-
141
-
142
-
143
-
144
-
145
-
146
-
147
-
148
-
149
-
150
-
151
-
152
-
153
-
154
-
155
-
156
-
157
-
158
-
159
-
160
-
161
-
162
-
163
-
164
-
165
-
166
-
167
-
168
-
169
-
170
-
171
-
172
-
173
-
174
-
175
-
176
 |
 |

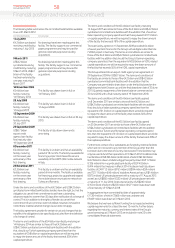
48
Vodafone Group Plc
Annual Report 2012
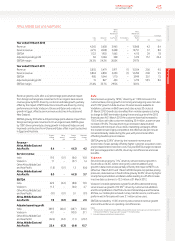
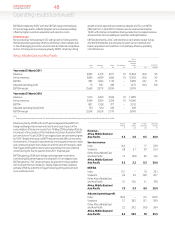
Africa, Middle East and Asia Pacic
India
£m
Vodacom
£m
Other
£m
Eliminations
£m
Africa,
Middle East
and Asia
Pacic
£m
% change
£m Organic1
Year ended 31 March 2011
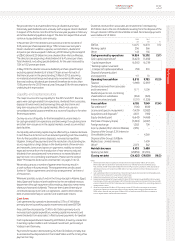
Revenue 3,855 5,479 3,971 (1) 13,304 20.0 9.5
Service revenue 3,804 4,839 3,650 (1) 12,292 20.0 9.5
EBITDA 985 1,844 1,170 – 3,999 20.7 7.5
Adjusted operating prot 15 827 430 – 1,272 55.5 8.6
EBITDA margin 25.6% 33.7% 29.5% 30.1%
Year ended 31 March 2010
Revenue 3,114 4,450 3,526 (1) 11,089
Service revenue 3,069 3,954 3,224 (1) 10,246
EBITDA 807 1,528 977 – 3,312
Adjusted operating (loss)/prot (37) 520 335 – 818
EBITDA margin 25.9% 34.3% 27.7% 29.9%
Note:
1 Organic growth includes Vodacom at the 2011 level of ownership and excludes Australia following the merger with Hutchison 3G Australia on 9 June 2009.
Revenue grew by 20.0% with an 8.5 percentage point benet from
foreign exchange rate movements and the full year impact of the
consolidation of Vodacom results from 18 May 2009 partially offset by
the impact of the creation of the Vodafone Hutchison Australia (‘VHA’)
joint venture on 9 June 2009. On an organic basis service revenue grew
by 9.5%* despite the impact of MTR reductions and difcult economic
environments. The growth was driven by a strong performance in India
and continued growth from Vodacom and the rest of the region, other
than Egypt where performance was impacted by the socio-political
unrest during the fourth quarter of the 2011 nancial year.
EBITDA grew by 20.8% with foreign exchange rate movements
contributing 8.0 percentage points of growth. On an organic basis
EBITDA grew by 7.5%* driven primarily by growth in India, together
withimprovements in Vodacom, Ghana, Qatar and New Zealand,
partially offset by a decline in Egypt following pricing pressure and
socio-political unrest.
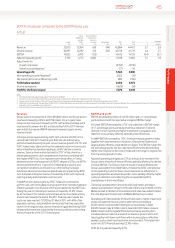
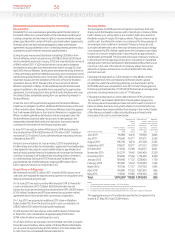
Organic
change
%
M&A
activity
pps
Foreign
exchange
pps
Reported
change
%
Revenue –
Africa, Middle East and
Asia Pacic 9.5 2.0 8.5 20.0
Service revenue
India 16.2 – 7.7 23.9
Vodacom 5.8 6.7 9.9 22.4
Other Africa, Middle East
and Asia Pacic 7.2 (0.9) 6.9 13.2
Africa, Middle East and
Asia Pacic 9.5 2.2 8.3 20.0
EBITDA
India 15.1 – 7.0 22.1
Vodacom 4.9 4.9 10.9 20.7
Other Africa, Middle East
and Asia Pacic 5.1 10.6 4.1 19.8
Africa, Middle East and
Asia Pacic 7.5 5.3 8.0 20.8
Adjusted operating prot
India 134.0 – 6.5 140.5
Vodacom 5.7 38.2 15.1 59.0
Other Africa, Middle East
and Asia Pacic 2.2 29.2 (3.0) 28.4
Africa, Middle East and
Asia Pacic 8.6 39.9 7.0 55.5
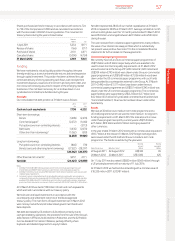
Operating results (continued)
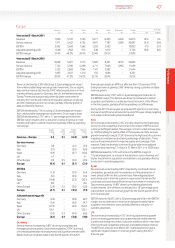
EBITDA increased by 8.0%* with the EBITDA margin increasing by
0.7percentage points, reecting higher service revenue partially
offsetby higher customer acquisition and retention costs.
Other Europe
Service revenue increased by 0.5%* with growth in Turkey and the
Netherlands being partially offset by declines in other markets due
tothe challenging economic environment and intense competitive
factors. In Turkey service revenue grew by 28.9%* driven by strong
growth in both data and voice revenue, despite a 52% cut in MTRs
effective from 1 April 2010. In Greece service revenue declined by
19.4%* with intense competition driving a reduction in prepaid revenue
and economic factors leading to customer tariff optimisation.
EBITDA declined by 2.4%*, with declines in all markets except Turkey
and the Netherlands, due primarily to lower service revenue and
higheracquisition and retention costs partially offset by operating
costefciencies.