Vodafone 2012 Annual Report Download - page 46
Download and view the complete annual report
Please find page 46 of the 2012 Vodafone annual report below. You can navigate through the pages in the report by either clicking on the pages listed below, or by using the keyword search tool below to find specific information within the annual report.-
 1
1 -
2
-
3
-
4
-
5
-
6
-
7
-
8
-
9
-
10
-
11
-
12
-
13
-
14
-
15
-
16
-
17
-
18
-
19
-
20
-
21
-
22
-
23
-
24
-
25
-
26
-
27
-
28
-
29
-
30
-
31
-
32
-
33
-
34
-
35
-
 36
36 -
 37
37 -
 38
38 -
 39
39 -
 40
40 -
 41
41 -
 42
42 -
 43
43 -
 44
44 -
 45
45 -
 46
46 -
 47
47 -
 48
48 -
 49
49 -
 50
50 -
 51
51 -
 52
52 -
 53
53 -
 54
54 -
 55
55 -
 56
56 -
57
-
58
-
59
-
60
-
61
-
62
-
63
-
64
-
65
-
66
-
67
-
68
-
69
-
70
-
71
-
72
-
73
-
74
-
75
-
76
-
77
-
78
-
79
-
80
-
81
-
82
-
83
-
84
-
85
-
86
-
87
-
88
-
89
-
90
-
91
-
92
-
93
-
94
-
95
-
96
-
97
-
98
-
99
-
100
-
101
-
102
-
103
-
104
-
105
-
106
-
107
-
108
-
109
-
110
-
111
-
112
-
113
-
114
-
115
-
116
-
117
-
118
-
119
-
120
-
121
-
122
-
123
-
124
-
125
-
126
-
127
-
128
-
129
-
130
-
131
-
132
-
133
-
134
-
135
-
136
-
137
-
138
-
139
-
140
-
141
-
142
-
143
-
144
-
145
-
146
-
147
-
148
-
149
-
150
-
151
-
152
-
153
-
154
-
155
-
156
-
157
-
158
-
159
-
160
-
161
-
162
-
163
-
164
-
165
-
166
-
167
-
168
-
169
-
170
-
171
-
172
-
173
-
174
-
175
-
176
 |
 |

44
Vodafone Group Plc
Annual Report 2012
Operating results (continued)
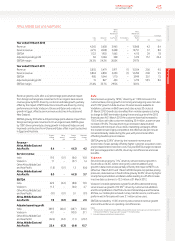
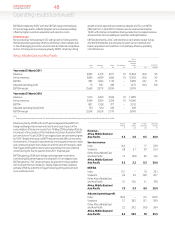
Other Africa, Middle East and Asia Pacic
Organic service revenue, which now includes Australia, declined by
1.8%* with both New Zealand and Australia being impacted by MTR
cutseffective from 6 May 2011 and 1 January 2012, respectively. In
Australia, despite improvements in network and customer operations
performance, service revenue declined by 8.8%* driven by the
competitive market and weakness in brand perception following the
network and customer service issues experienced from late 2010 to
early 2011 and further accelerated by MTR cuts. On 22 March 2012,
Vodafone Hutchison Australia appointed Bill Morrow as its new CEO.
InEgypt service revenue was suppressed by the challenging economic
and political environment, however, organic growth of 1.4%* was
achieved as a result of an increased customer base and strong data
usage. In Qatar an increase in the customer base delivered service
revenue growth of 27.1%*, despite a competitive pricing environment.
Service revenue in Ghana grew by 29.2%* through strong gains in
customer market share.
EBITDA margin declined 2.2* percentage points, driven by the service
revenue decline in Australia and the challenging economic and
competitive environment in Egypt, partially offset by growth in Qatar
and Ghana.
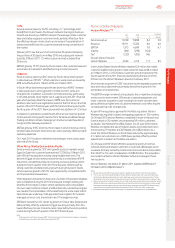
Safaricom, Vodafone’s associate in Kenya, grew service revenue by
13.6%*, driven by increases in customer base, voice usage and M-Pesa
activity. EBITDA margin improved in the second half of the 2012 nancial
year through a tariff increase in October, operating cost efciencies and
a strengthening of the local currency to take the margin for the 2012
nancial year to 35.0%.
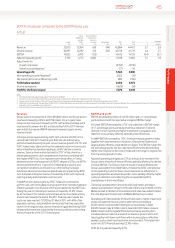
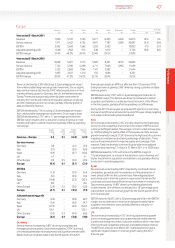
Non-Controlled Interests
Verizon Wireless1 2 3
2012
£m
2011
£m
% change
£ Organic
Service revenue 18,039 17,238 4.6 7.3
Revenue 20,187 18,711 7.9 10.6
EBITDA 7.689 7,313 5.1 7.9
Interest (212) (261) (18.8)
Tax2(287) (235) 22.1
Group’s share of result in
Verizon Wireless 4,867 4,569 6.5 9.3
In the United States Verizon Wireless reported 4.6 million net mobile
customer additions bringing its closing mobile customer base to
93.0million, up 5.2%.
Service revenue growth of 7.3%* continues to be driven by the
expanding customer base and robust growth in data ARPU driven
byincreased penetration ofsmartphones.
EBITDA margin remained strong despite the competitive challenges
andmacroeconomic environment. Efciencies in operating expenses
and customer acquisition costs resulting from lower volumes havebeen
partly offset by a higher level of customer retention costs reecting the
increased demand for smartphones.
Verizon Wireless’ net debt at 31 March 2012 totalled US$6.4 billion4
(31March 2011: net debt US$9.8 billion4), after paying a dividend to its
shareholders of US$10 billion on 31 January 2012.
Notes:
1 All amounts represent the Group’s share based on its 45% equity interest, unless otherwise stated.
2 The Group’s share of the tax attributable to Verizon Wireless relates only to the corporate entities held by
the Verizon Wireless partnership and certain state taxes which are levied on the partnership. The tax
attributable to the Group’s share of the partnership’s pre-tax prot is included within the Group tax charge.
3 Organic growth rates include the impact of a non-cash revenue adjustment which was recorded to defer
previously recognised data revenue that will be earned and recognised in future periods. Excluding this the
equivalent organic growth rates for service revenue, revenue, EBITDA and the Group’s share of result in
Verizon Wireless would have been 6.8%*, 10.1%*, 6.7%* and 7.5%* respectively.
4 Net debt excludes pending credit card receipts. Comparatives are presented on a comparable basis.