Vodafone 2012 Annual Report Download - page 83
Download and view the complete annual report
Please find page 83 of the 2012 Vodafone annual report below. You can navigate through the pages in the report by either clicking on the pages listed below, or by using the keyword search tool below to find specific information within the annual report.-
 1
1 -
2
-
3
-
4
-
5
-
6
-
7
-
8
-
9
-
10
-
11
-
12
-
13
-
14
-
15
-
16
-
17
-
18
-
19
-
20
-
21
-
22
-
23
-
24
-
25
-
26
-
27
-
28
-
29
-
30
-
31
-
32
-
33
-
34
-
35
-
36
-
37
-
38
-
39
-
40
-
41
-
42
-
43
-
44
-
45
-
46
-
47
-
48
-
49
-
50
-
51
-
52
-
53
-
54
-
55
-
56
-
57
-
58
-
59
-
60
-
61
-
62
-
63
-
64
-
65
-
66
-
67
-
68
-
69
-
70
-
71
-
72
-
 73
73 -
 74
74 -
 75
75 -
 76
76 -
 77
77 -
 78
78 -
 79
79 -
 80
80 -
 81
81 -
 82
82 -
 83
83 -
 84
84 -
 85
85 -
 86
86 -
 87
87 -
 88
88 -
 89
89 -
 90
90 -
 91
91 -
 92
92 -
 93
93 -
94
-
95
-
96
-
97
-
98
-
99
-
100
-
101
-
102
-
103
-
104
-
105
-
106
-
107
-
108
-
109
-
110
-
111
-
112
-
113
-
114
-
115
-
116
-
117
-
118
-
119
-
120
-
121
-
122
-
123
-
124
-
125
-
126
-
127
-
128
-
129
-
130
-
131
-
132
-
133
-
134
-
135
-
136
-
137
-
138
-
139
-
140
-
141
-
142
-
143
-
144
-
145
-
146
-
147
-
148
-
149
-
150
-
151
-
152
-
153
-
154
-
155
-
156
-
157
-
158
-
159
-
160
-
161
-
162
-
163
-
164
-
165
-
166
-
167
-
168
-
169
-
170
-
171
-
172
-
173
-
174
-
175
-
176
 |
 |
Business review Performance Governance Financials Additional information
81
Vodafone Group Plc
Annual Report 2012
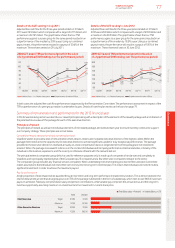
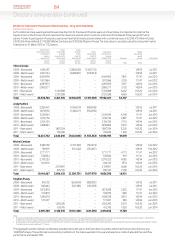
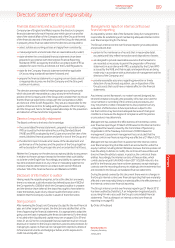
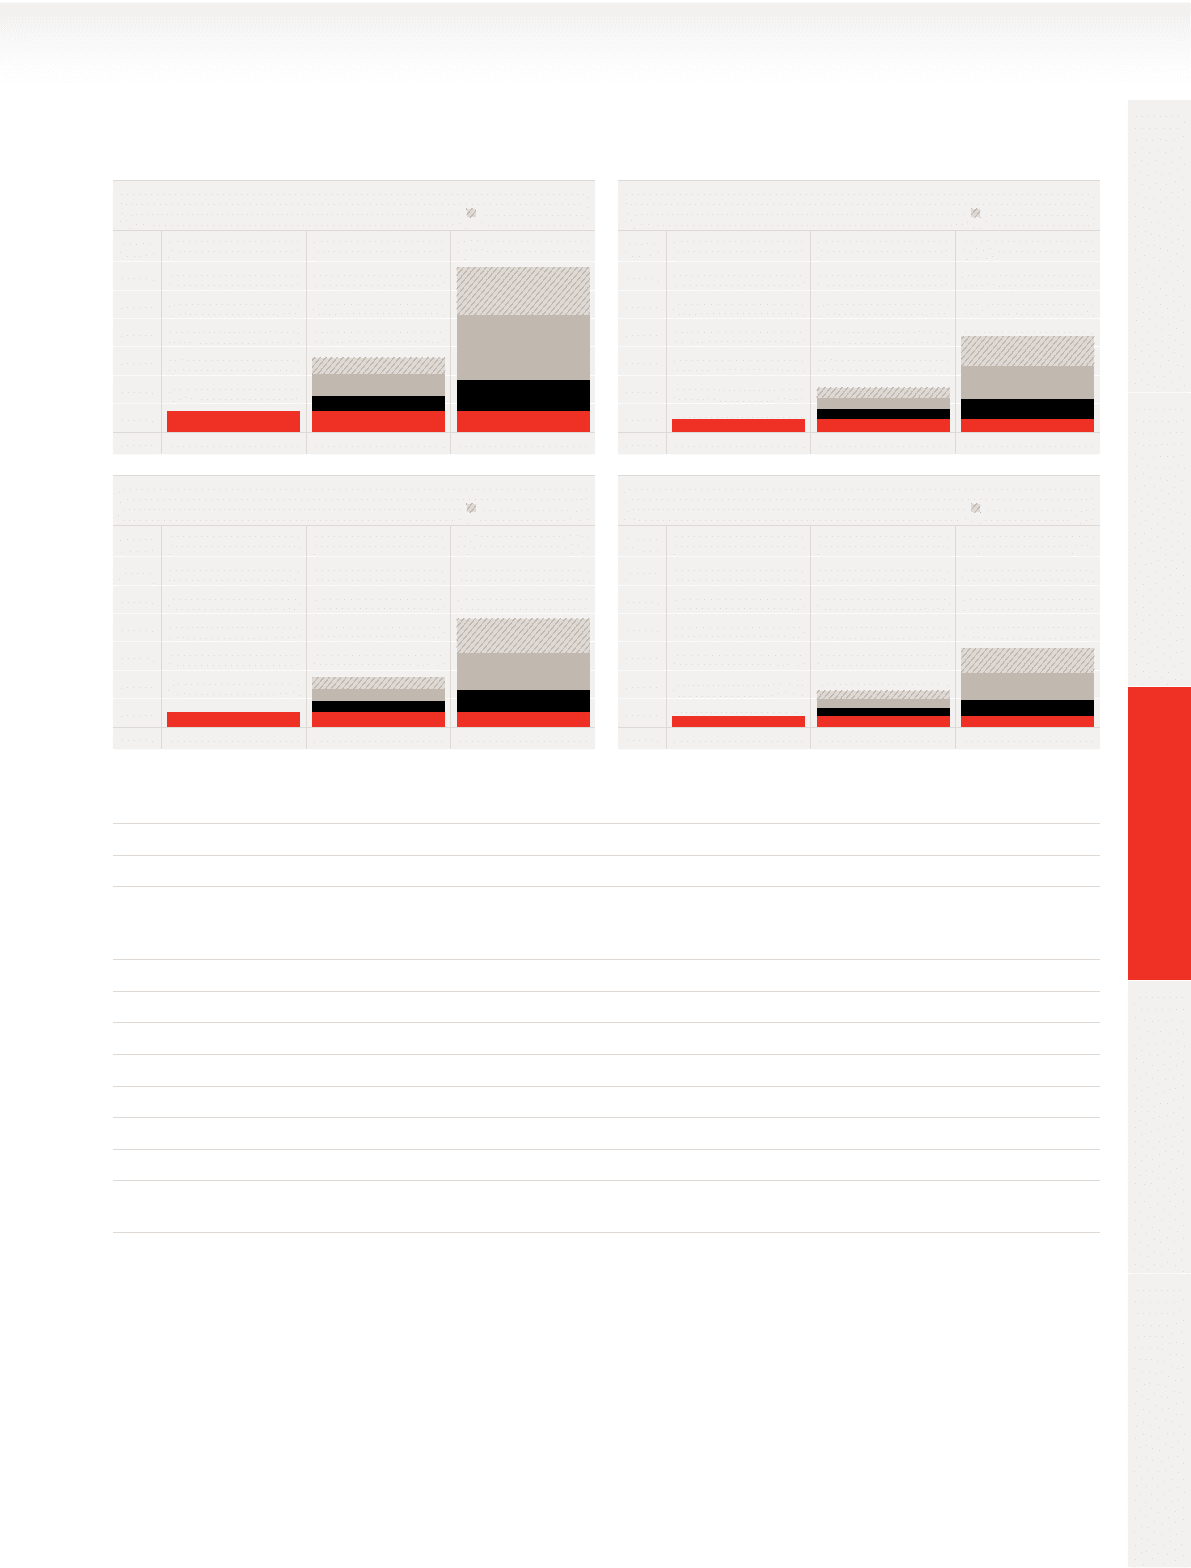
Estimates of total future potential remuneration from 2013 pay packages
The tables below provide estimates of the potential future remuneration for each of the executive directors based on the remuneration opportunity
granted in the 2013 nancial year. Potential outcomes based on different performance scenarios are provided for each executive director.
Vittorio Colao, Chief Executive
10,000
12,000
8,000
6,000
4,000
2,000
0
Minimum Target Maximum
£’000 Salary and benets GSTIP GLTI base award
GLTI matching award
Andy Halford, Chief Financial Ofcer
10,000
12,000
8,000
6,000
4,000
2,000
0
Minimum Target Maximum
£’000 Salary and benets GSTIP GLTI base award
GLTI matching award
Michel Combes, Regional CEO Europe
10,000
12,000
8,000
6,000
4,000
2,000
0
Minimum Target Maximum
£’000 Salary and benets GSTIP GLTI base award
GLTI matching award
Stephen Pusey, Chief Technology Ofcer
10,000
12,000
8,000
6,000
4,000
2,000
0
Minimum Target Maximum
£’000 Salary and benets GSTIP GLTI base award
GLTI matching award
The assumptions underlying each scenario are described below.
All scenarios
a Other benets reect those which were paid in the year to 31 March 2012, plus pension.
a Each executive is assumed to co-invest the maximum allowed under the GLTI, 100% of salary, and the GLTI matching award reects this.
a The amounts shown for the GSTIP and GLTI are based on the salary disclosed on page 80. The actual amounts for the GLTI will be based on the
share price on the date the award vests in 2015. They do not include an estimate of dividend equivalents which accumulate on the vested shares
and are paid in cash to the executive after the award vests.
Below threshold
a No pay for performance is payable.
Target
a The target award opportunity for the GSTIP is 100% of base salary.
a The target levels of performance for the GLTI are discussed in detail on page 80. We assumed that TSR performance was at median.
Maximum
a Two times the target award opportunity is payable under the GSTIP.
a The maximum levels of performance for the GLTI are discussed in detail on page 80. We assumed that TSR performance was at or above the 80th
percentile.