Vodafone 2012 Annual Report Download - page 78
Download and view the complete annual report
Please find page 78 of the 2012 Vodafone annual report below. You can navigate through the pages in the report by either clicking on the pages listed below, or by using the keyword search tool below to find specific information within the annual report.-
 1
1 -
2
-
3
-
4
-
5
-
6
-
7
-
8
-
9
-
10
-
11
-
12
-
13
-
14
-
15
-
16
-
17
-
18
-
19
-
20
-
21
-
22
-
23
-
24
-
25
-
26
-
27
-
28
-
29
-
30
-
31
-
32
-
33
-
34
-
35
-
36
-
37
-
38
-
39
-
40
-
41
-
42
-
43
-
44
-
45
-
46
-
47
-
48
-
49
-
50
-
51
-
52
-
53
-
54
-
55
-
56
-
57
-
58
-
59
-
60
-
61
-
62
-
63
-
64
-
65
-
66
-
67
-
 68
68 -
 69
69 -
 70
70 -
 71
71 -
 72
72 -
 73
73 -
 74
74 -
 75
75 -
 76
76 -
 77
77 -
 78
78 -
 79
79 -
 80
80 -
 81
81 -
 82
82 -
 83
83 -
 84
84 -
 85
85 -
 86
86 -
 87
87 -
 88
88 -
89
-
90
-
91
-
92
-
93
-
94
-
95
-
96
-
97
-
98
-
99
-
100
-
101
-
102
-
103
-
104
-
105
-
106
-
107
-
108
-
109
-
110
-
111
-
112
-
113
-
114
-
115
-
116
-
117
-
118
-
119
-
120
-
121
-
122
-
123
-
124
-
125
-
126
-
127
-
128
-
129
-
130
-
131
-
132
-
133
-
134
-
135
-
136
-
137
-
138
-
139
-
140
-
141
-
142
-
143
-
144
-
145
-
146
-
147
-
148
-
149
-
150
-
151
-
152
-
153
-
154
-
155
-
156
-
157
-
158
-
159
-
160
-
161
-
162
-
163
-
164
-
165
-
166
-
167
-
168
-
169
-
170
-
171
-
172
-
173
-
174
-
175
-
176
 |
 |

76
Vodafone Group Plc
Annual Report 2012
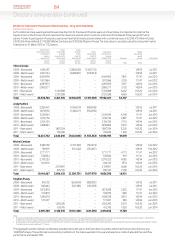
Summary of remuneration for the 2012 nancial year
In this section we summarise the pay packages awarded to our executive directors for performance in the 2012 nancial year versus 2011.
Specically we have provided a table that shows all remuneration that was received by the individual during the year. In response to the debate on
simplifying remuneration disclosure we have included a single total remuneration value for the year. Although there are some technical difculties in
arriving at a single value, particularly concerning the timing and valuation of awards which may not be aligned with the nancial year end, we have
attempted to provide the data in a logical format along with accompanying explanatory notes. Specically we have included the value of the
short-term incentive (‘GSTIP’) that was earned during the year but paid out in the following year and the value of long-term incentive (‘GLTI’) that
vested and paid out during the year. For completeness the GLTI that vests in the following year has also been included in a separate table below
although in the case of the award vesting in June 2012, the value can only be estimated at this stage.
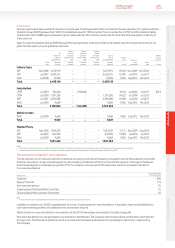
Total remuneration for the 2012 nancial year
Vittorio Colao Andy Halford Michel Combes Stephen Pusey
2012 2011 2012 2011 2012 2011 2012 2011
£’000 £’000 £’000 £’000 £’000 £’000 £’000 £’000
Salary/fees 1,099 1,043 700 694 785 763 569 538
GSTIP 1,037 1,323 654 869 728 745 537 683
GLTI vesting during the year 1 3,745 590 2,289 451 1,776 – 758 186
Cash in lieu of GLTI dividends2545 92 333 70 326 – 110 29
Cash in lieu of pension 330 313 210 208 236 229 171 161
Benets /other 3 24 55 30 27 25 22 21 31
Total 6,780 3,416 4,216 2,319 3,876 1,759 2,166 1,628
Notes:
1 The value shown in the 2012 column is for the award which vested on 29 July 2011 and is valued using the closing share price on that day of 171.7 pence; the value shown in the 2011 column is for the award which vested on
24July 2010 using the closing share price on the rst trading day after the award vested (26 July 2010) of 151.5 pence. Michel Combes’ award did not vest until 12 February 2012 and is valued using the closing share price on
thatday of174.5 pence.
2 Under the GLTI rules, participants receive a cash award equivalent to any dividends that would have been paid on the matching shares during the performance period.
3 Includes amounts in respect of cost of living allowance, private healthcare and car allowance.
GLTI awards with a performance period ending on the 31 March of the year under review but that do not vest until the following
nancial year 1:
2012
Vittorio Colao
2011 2012
Andy Halford
2011 2012
Michel Combes
2011 2012
Stephen Pusey
2011
GLTI base shares 4,564,995 1,262,735 2,524,934 698,428 2,771,771 792,473 1,872,818 288,292
GLTI matching shares 1,817,866 918,353 1,676,756 634,935 533,854 225,497 510,879 153,258
Total value of GLTI awards £’000 10,991 3,745 7,235 2,289 5,692 1,776 4,105 758
Note:
1 The awards summarised in this table represent those that vested after the close of the nancial year, but are based on the three-year performance period ended at 31 March 2012 for the awards shown in the 2012 column,
and 31 March 2011 for the awards shown in the 2011 column. The awards listed under 2012 will not vest until 30 June 2012. Wevalued the award using a closing share price on 31 March 2012 of 172.2 pence, however, the nal
award value will not be certain until the award vests.
In light of the high value of the award that will vest in June, Vittorio Colao has committed to hold 100% of the shares that vest (net of those sold to
cover tax) for an additional two years. Similarly the other executive directors have all agreed to hold 50% (net of those sold to cover tax) for the same
period.
Below we summarise our performance over the nancial year, and three-year performance period ended 31 March 2012, which resulted in the
remuneration disclosed in the above tables.
Details of the GSTIP payout
In the table below we describe our achievement against each of the performance measures in our annual bonus plan (‘GSTIP’) and the resulting total
incentive payout level for the year ended 31 March 2012 of 93.4%. Vittorio Colao, Andy Halford and Stephen Pusey were measured purely on Group
performance whilst Michel Combes was measured on a combination of Group and Europe region performance. The corresponding total incentive
payout for Michel Combes was 92.1%. Details of how this works can be found on page 79.
Performance measure
Payout at target
performance
100%
Payout at maximum
performance
200% Actual payout Commentary
Service revenue 25% 50% 25.8% Organic service revenue up 1.5% in the year.
EBITDA 25% 50% 24.8% In-line with market guidance for the year.
Adjusted free cash ow 20% 40% 8.5% Within the range of market guidance.
Competitive performance assessment 30% 60% 34.3% Outperformance of key competitors in most markets.
Ranked rst or second for net promoter score in over
70% of our markets.
Total incentive payout level 100% 200% 93.4%
Directors’ remuneration (continued)