Vodafone 2012 Annual Report Download - page 43
Download and view the complete annual report
Please find page 43 of the 2012 Vodafone annual report below. You can navigate through the pages in the report by either clicking on the pages listed below, or by using the keyword search tool below to find specific information within the annual report.-
 1
1 -
2
-
3
-
4
-
5
-
6
-
7
-
8
-
9
-
10
-
11
-
12
-
13
-
14
-
15
-
16
-
17
-
18
-
19
-
20
-
21
-
22
-
23
-
24
-
25
-
26
-
27
-
28
-
29
-
30
-
31
-
32
-
 33
33 -
 34
34 -
 35
35 -
 36
36 -
 37
37 -
 38
38 -
 39
39 -
 40
40 -
 41
41 -
 42
42 -
 43
43 -
 44
44 -
 45
45 -
 46
46 -
 47
47 -
 48
48 -
 49
49 -
 50
50 -
 51
51 -
 52
52 -
 53
53 -
54
-
55
-
56
-
57
-
58
-
59
-
60
-
61
-
62
-
63
-
64
-
65
-
66
-
67
-
68
-
69
-
70
-
71
-
72
-
73
-
74
-
75
-
76
-
77
-
78
-
79
-
80
-
81
-
82
-
83
-
84
-
85
-
86
-
87
-
88
-
89
-
90
-
91
-
92
-
93
-
94
-
95
-
96
-
97
-
98
-
99
-
100
-
101
-
102
-
103
-
104
-
105
-
106
-
107
-
108
-
109
-
110
-
111
-
112
-
113
-
114
-
115
-
116
-
117
-
118
-
119
-
120
-
121
-
122
-
123
-
124
-
125
-
126
-
127
-
128
-
129
-
130
-
131
-
132
-
133
-
134
-
135
-
136
-
137
-
138
-
139
-
140
-
141
-
142
-
143
-
144
-
145
-
146
-
147
-
148
-
149
-
150
-
151
-
152
-
153
-
154
-
155
-
156
-
157
-
158
-
159
-
160
-
161
-
162
-
163
-
164
-
165
-
166
-
167
-
168
-
169
-
170
-
171
-
172
-
173
-
174
-
175
-
176
 |
 |

Business review Performance Governance Financials Additional information
41
Vodafone Group Plc
Annual Report 2012
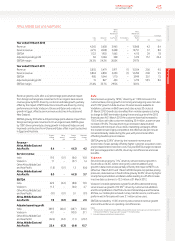
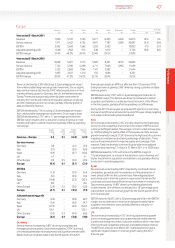
Taxation
2012
£m
2011
£m
Income tax expense 2,546 1,628
Tax on adjustments to derive
adjusted prot before tax (242) (232)
Tax benet related to
settlement of tax cases – 929
Adjusted income tax expense 2,304 2,325
Share of associates’ tax 302 519
Adjusted income tax expense for
purposes of calculating adjusted
taxrate 2,606 2,844
Prot before tax 9,549 9,498
Adjustments to derive adjusted
prot before tax1369 1,505
Adjusted prot before tax 9,918 11,003
Add: Share of associates’ tax and
non-controlling interest 382 604
Adjusted prot before tax for the
purpose of calculating adjusted
effective tax rate 10,300 11,607
Adjusted effective tax rate 25.3% 24.5%
Note:
1 See “Earnings per share”.
The adjusted effective tax rate for the year ended 31 March 2012 was
25.3%. This is in line with our mid 20s adjusted effective tax rate
guidance range.
The Group’s share of associates’ tax declined due to the absence of
thetax related to SFR following the disposal of our 44% interest in
June2011.
Income tax expense has increased in the year ended 31 March 2012
largely due to the favourable impact of a tax settlement in the 2011
nancial year.
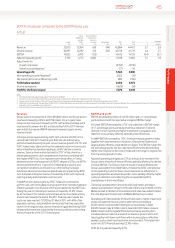
Earnings per share
Adjusted earnings per share was 14.91 pence, a decline of 11.0%
year-on-year, reecting the loss of our 44% interest in SFR and
Polkomtel’s prots, the loss of interest income from investment
disposals and mark-to-market items charged through nance costs,
partially offset by a reduction in shares arising from the Group’s share
buyback programme. Basic earnings per share was 13.74 pence (2011:
15.20 pence), reecting the prot on disposal of our 44% interest in SFR
and 24.4% interest in Polkomtel and lower impairment charges
compared to the prior nancial year, all of which are excluded from
adjusted earnings per share.
2012
£m
2011
£m
Prot attributable to equity shareholders 6,957 7,968
Pre-tax adjustments:
Impairment loss14,050 6,150
Other income and expense1 2 (3,705) 72
Non-operating income and expense1 3162 (3,022)
Investment income and nancing costs4(138) (1,695)
369 1,505
Taxation1242 (697)
Non-controlling interests (18) –
Adjusted prot attributable to equity
shareholders 7,550 8,776
Million Million
Weighted average number of shares outstanding
Basic 50,644 52,408
Diluted 50,958 52,748
Notes:
1 Taxation for the 2012 nancial year includes a £206 million charge in respect of the disposal of the Group’s
24.4% interest in Polkomtel. The 2011 nancial year included £929 million credit in respect of a tax
settlement and a £208 million charge in respect of the disposal of the Group’s 3.2% interest in China Mobile
Limited. The impairment charges of £4,050 million and £6,150 million in the 2012 and 2011 nancial years
respectively do not result in any tax consequences. The disposal of our 44% interest in SFR did not give rise
to a tax charge.
2 Other income and expense for the 2012 nancial year includes a £3,419 million gain on disposal of the
Group’s 44% interest in SFR and a £296 million gain on disposal of the Group’s 24.4% interest in Polkomtel.
The 2011 nancial year includes £56 million representing the net loss on disposal of certain Alltel
investments by Verizon Wireless. This is included within the line item “Share of results in associates” in the
consolidated income statement.
3 Non-operating income and expense for the 2011 nancial year includes £3,019 million prot arising on the
sale of the Group’s 3.2% interest in China Mobile Limited.
4 See notes 2 and 3 in “Net (nancing costs)/investment income” on page 40.
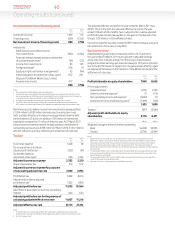
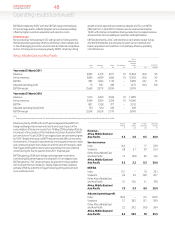
Europe
Germany
£m
Italy
£m
Spain
£m
UK
£m
Other
£m
Eliminations
£m
Europe
£m
% change
£m Organic
Year ended 31 March 2012
Revenue 8,233 5,658 4,763 5,397 8,352 (222) 32,181 0.5 (0.1)
Service revenue 7,669 5,329 4,357 4,996 7,780 (217) 29,914 (0.6) (1.1)
EBITDA 2,965 2,514 1,193 1,294 2,479 – 10,445 (3.5) (4.5)
Adjusted operating prot 1,491 1,735 566 402 1,066 – 5,260 (8.1) (9.6)
EBITDA margin 36.0% 44.4% 25.0% 24.0% 29.7% 32.5%
Year ended 31 March 2011
Revenue 7,900 5,722 5,133 5,271 8,253 (264) 32,015 (2.5) 0.6
Service revenue 7,471 5,432 4,735 4,931 7,787 (259) 30,097 (3.4) (0.4)
EBITDA 2,952 2,643 1,562 1,233 2,433 – 10,823 (7.1) (3.7)
Adjusted operating prot 1,548 1,903 915 348 1,012 – 5,726 (9.8) (6.1)
EBITDA margin 37.4% 46.2% 30.4% 23.4% 29.5% – 33.8%