Vodafone 2012 Annual Report Download - page 166
Download and view the complete annual report
Please find page 166 of the 2012 Vodafone annual report below. You can navigate through the pages in the report by either clicking on the pages listed below, or by using the keyword search tool below to find specific information within the annual report.-
 1
1 -
2
-
3
-
4
-
5
-
6
-
7
-
8
-
9
-
10
-
11
-
12
-
13
-
14
-
15
-
16
-
17
-
18
-
19
-
20
-
21
-
22
-
23
-
24
-
25
-
26
-
27
-
28
-
29
-
30
-
31
-
32
-
33
-
34
-
35
-
36
-
37
-
38
-
39
-
40
-
41
-
42
-
43
-
44
-
45
-
46
-
47
-
48
-
49
-
50
-
51
-
52
-
53
-
54
-
55
-
56
-
57
-
58
-
59
-
60
-
61
-
62
-
63
-
64
-
65
-
66
-
67
-
68
-
69
-
70
-
71
-
72
-
73
-
74
-
75
-
76
-
77
-
78
-
79
-
80
-
81
-
82
-
83
-
84
-
85
-
86
-
87
-
88
-
89
-
90
-
91
-
92
-
93
-
94
-
95
-
96
-
97
-
98
-
99
-
100
-
101
-
102
-
103
-
104
-
105
-
106
-
107
-
108
-
109
-
110
-
111
-
112
-
113
-
114
-
115
-
116
-
117
-
118
-
119
-
120
-
121
-
122
-
123
-
124
-
125
-
126
-
127
-
128
-
129
-
130
-
131
-
132
-
133
-
134
-
135
-
136
-
137
-
138
-
139
-
140
-
141
-
142
-
143
-
144
-
145
-
146
-
147
-
148
-
149
-
150
-
151
-
152
-
153
-
154
-
155
-
 156
156 -
 157
157 -
 158
158 -
 159
159 -
 160
160 -
 161
161 -
 162
162 -
 163
163 -
 164
164 -
 165
165 -
 166
166 -
 167
167 -
 168
168 -
 169
169 -
 170
170 -
 171
171 -
 172
172 -
 173
173 -
 174
174 -
 175
175 -
 176
176
 |
 |

164
Vodafone Group Plc
Annual Report 2012
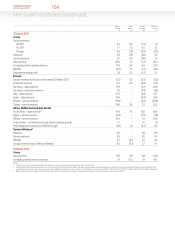
Organic
change
%
M&A
activity
pps
Foreign
exchange
pps
Reported
change
%
31 March 2011
Group
Service revenue
H2 2011 2.5 0.2 (1.5) 1.2
H1 2011 1.7 1.5 0.5 3.7
Change 0.8 (1.3) (2.0) (2.5)
Revenue 2.8 0.8 (0.4) 3.2
Service revenue 2.1 0.9 (0.6) 2.4
Data revenue 26.4 1.2 (1.2) 26.4
Emerging markets service revenue 11.8 3.4 6.8 22.0
EBITDA (0.7) 1.4 (1.1) (0.4)
Adjusted operating prot 1.8 2.5 (1.2) 3.1
Europe
Service revenue for the six months ended 31 March 2011 (0.3) 0.2 (3.5) (3.6)
Enterprise revenue 0.5 0.2 (3.2) (2.5)
Germany – data revenue 27.9 – (5.1) 22.8
Germany – enterprise revenue 3.6 – (4.2) (0.6)
Italy – data revenue 21.5 – (4.8) 16.7
Spain – data revenue 14.8 – (4.8) 10.0
Greece – service revenue (19.4) – (3.2) (22.6)
Turkey – service revenue 28.9 3.6 2.7 35.2
Africa, Middle East and Asia Pacic
South Africa – data revenue341.8 9.5 15.6 66.9
Egypt – service revenue (0.8) – (1.0) (1.8)
Ghana – service revenue 21.0 – 1.6 22.6
Indus Towers – contribution to India service revenue growth 1.7 – 0.1 1.8
Percentage point reduction in EBITDA margin (0.6) 1.0 (0.2) 0.2
Verizon Wireless2
Revenue 6.0 – 2.6 8.6
Service revenue 5.8 – 2.6 8.4
EBITDA 6.7 (0.1) 2.7 9.3
Group’s share of result of Verizon Wireless 8.5 (0.1) 2.7 11.1
31 March 2010
Group
Data revenue 19.3 6.9 6.8 33.0
Emerging markets service revenue 7.9 31.3 7.9 47.1
Notes:
1 “Other activity” includes the impact of M&A activity and the revision to intra-group roaming recharges from 1 October 2012.
2 Organic growth rates include the impact of a non-cash revenue adjustment which was recorded to properly defer previously recognised data revenue that will be earned and recognised in future periods. Excluding this the
equivalent growth rates for service revenue, revenue, adjusted EBITDA and the Group’s share of result in Verizon Wireless would have been 6.8%*, 10.1%*, 6.7%* and 7.5%* (2011: 6.4%*, 6.6%*, 8.2%* and 10.8%*) respectively.
3 Data revenue in South Africa grew by 41.8%*. Excluding the impact of reclassications between messaging and data revenue during the year, data revenue grew by 35.9%*.
Non-GAAP information (continued)