Vodafone 2012 Annual Report Download - page 34
Download and view the complete annual report
Please find page 34 of the 2012 Vodafone annual report below. You can navigate through the pages in the report by either clicking on the pages listed below, or by using the keyword search tool below to find specific information within the annual report.-
 1
1 -
2
-
3
-
4
-
5
-
6
-
7
-
8
-
9
-
10
-
11
-
12
-
13
-
14
-
15
-
16
-
17
-
18
-
19
-
20
-
21
-
22
-
23
-
 24
24 -
 25
25 -
 26
26 -
 27
27 -
 28
28 -
 29
29 -
 30
30 -
 31
31 -
 32
32 -
 33
33 -
 34
34 -
 35
35 -
 36
36 -
 37
37 -
 38
38 -
 39
39 -
 40
40 -
 41
41 -
 42
42 -
 43
43 -
 44
44 -
45
-
46
-
47
-
48
-
49
-
50
-
51
-
52
-
53
-
54
-
55
-
56
-
57
-
58
-
59
-
60
-
61
-
62
-
63
-
64
-
65
-
66
-
67
-
68
-
69
-
70
-
71
-
72
-
73
-
74
-
75
-
76
-
77
-
78
-
79
-
80
-
81
-
82
-
83
-
84
-
85
-
86
-
87
-
88
-
89
-
90
-
91
-
92
-
93
-
94
-
95
-
96
-
97
-
98
-
99
-
100
-
101
-
102
-
103
-
104
-
105
-
106
-
107
-
108
-
109
-
110
-
111
-
112
-
113
-
114
-
115
-
116
-
117
-
118
-
119
-
120
-
121
-
122
-
123
-
124
-
125
-
126
-
127
-
128
-
129
-
130
-
131
-
132
-
133
-
134
-
135
-
136
-
137
-
138
-
139
-
140
-
141
-
142
-
143
-
144
-
145
-
146
-
147
-
148
-
149
-
150
-
151
-
152
-
153
-
154
-
155
-
156
-
157
-
158
-
159
-
160
-
161
-
162
-
163
-
164
-
165
-
166
-
167
-
168
-
169
-
170
-
171
-
172
-
173
-
174
-
175
-
176
 |
 |
32
Vodafone Group Plc
Annual Report 2012
Core strengths
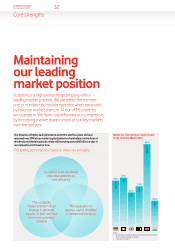
Maintaining
ourleading
market position
Vodafone is a high performing company with a
leading market position. We are either the number
one or number two mobile operator, when measured
by revenue market share, in 14 out of 18 countries
weoperate in. We have outperformed our competitors
by increasing market share in most of our key markets
over the last year.
Our business is highly cash generative and in the last four years we have
returned over 30% of our market capitalisation to shareholders in the form of
dividends and share buybacks, while still investing around £6billion a year in
our networks and infrastructure.
Our leading performance is based on three core strengths:
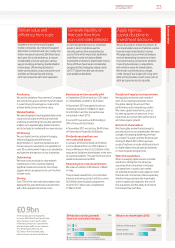
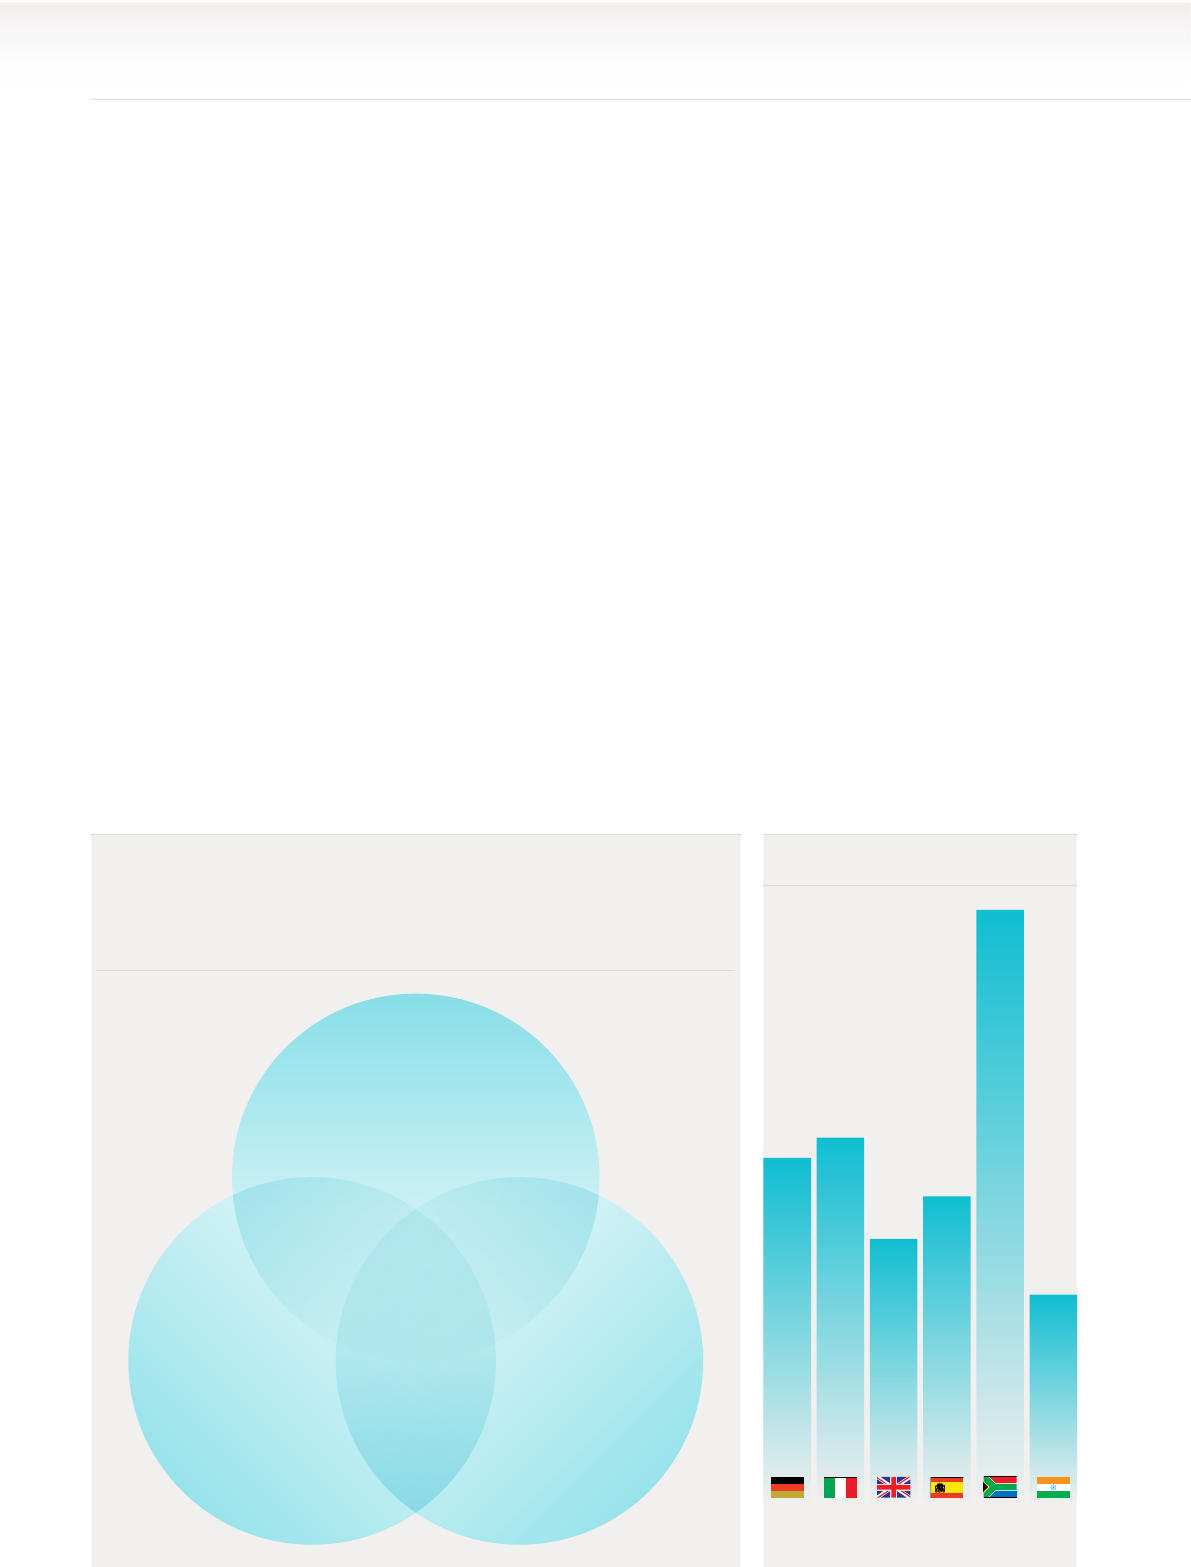
Mobile service revenue market share
in key markets March 2012
35%
Germany
37%
Italy
60%
Vodacom1
The successful
implementation of our
strategy to generate
liquidity or free cash ow
from non-controlled
interests
Our global scale advantage
and close attention to
cost efciency
The application of
rigorous capital discipline
to investment decisions
Notes:
1 Market share information relates to total revenue for South Africa
which is Vodacom’s largest business.
2 India: December 2011.
26%
UK
31%
Spain
21%
India2