Vodafone 2012 Annual Report Download - page 59
Download and view the complete annual report
Please find page 59 of the 2012 Vodafone annual report below. You can navigate through the pages in the report by either clicking on the pages listed below, or by using the keyword search tool below to find specific information within the annual report.-
 1
1 -
2
-
3
-
4
-
5
-
6
-
7
-
8
-
9
-
10
-
11
-
12
-
13
-
14
-
15
-
16
-
17
-
18
-
19
-
20
-
21
-
22
-
23
-
24
-
25
-
26
-
27
-
28
-
29
-
30
-
31
-
32
-
33
-
34
-
35
-
36
-
37
-
38
-
39
-
40
-
41
-
42
-
43
-
44
-
45
-
46
-
47
-
48
-
 49
49 -
 50
50 -
 51
51 -
 52
52 -
 53
53 -
 54
54 -
 55
55 -
 56
56 -
 57
57 -
 58
58 -
 59
59 -
 60
60 -
 61
61 -
 62
62 -
 63
63 -
 64
64 -
 65
65 -
 66
66 -
 67
67 -
 68
68 -
 69
69 -
70
-
71
-
72
-
73
-
74
-
75
-
76
-
77
-
78
-
79
-
80
-
81
-
82
-
83
-
84
-
85
-
86
-
87
-
88
-
89
-
90
-
91
-
92
-
93
-
94
-
95
-
96
-
97
-
98
-
99
-
100
-
101
-
102
-
103
-
104
-
105
-
106
-
107
-
108
-
109
-
110
-
111
-
112
-
113
-
114
-
115
-
116
-
117
-
118
-
119
-
120
-
121
-
122
-
123
-
124
-
125
-
126
-
127
-
128
-
129
-
130
-
131
-
132
-
133
-
134
-
135
-
136
-
137
-
138
-
139
-
140
-
141
-
142
-
143
-
144
-
145
-
146
-
147
-
148
-
149
-
150
-
151
-
152
-
153
-
154
-
155
-
156
-
157
-
158
-
159
-
160
-
161
-
162
-
163
-
164
-
165
-
166
-
167
-
168
-
169
-
170
-
171
-
172
-
173
-
174
-
175
-
176
 |
 |

Business review Performance Governance Financials Additional information
57
Vodafone Group Plc
Annual Report 2012
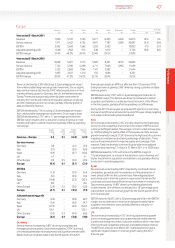
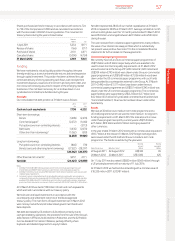
Shares purchased are held in treasury in accordance with sections 724
to 732 of the Companies Act 2006 and are cancelled in accordance
with the Association of British Insurers guidelines. The movement in
treasury shares during the year is shown below:
Number
Million £m
1 April 2011 5,234 8,171
Reissue of shares (166) (277)
Purchase of shares 2,101 4,671
Cancelled shares (3,000) (4,724)
31 March 2012 4,169 7,841
Funding
We have maintained a robust liquidity position throughout the year
thereby enabling us to service shareholder returns, debt and expansion
through capital investment. This position has been achieved through
continued delivery of strong operating cash ows, cash receipts from
investment disposals, issuances of short-term and long-term debt, and
non-recourse borrowing assumed in respect of the emerging market
businesses. It has not been necessary for us to draw down on our
syndicated committed bank facilities during the year.
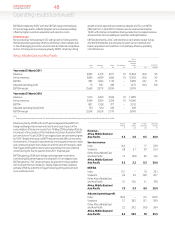
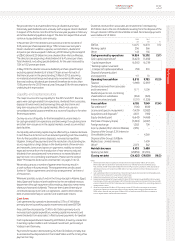
Net debt
Our consolidated net debt position at 31 March was as follows:
2012 2011
£m £m
Cash and cash equivalents 7,138 6,252
Short-term borrowings:
Bonds (1,289) (2,470)
Commercial paper1(2,272) (1,660)
Put options over non-controlling interests – (3,113)
Bank loans (1,635) (2,070)
Other short-term borrowings2(1,062) (593)
(6,258) (9,906)
Long-term borrowings:
Put options over non-controlling interests (840) (78)
Bonds, loans and other long-term borrowings (27,522) (28,297)
(28,362) (28,375)
Other nancial instruments33,057 2,171
Net debt (24,425) (29,858)
Notes:
1 At 31 March 2012 US$1,689 million was drawn under the US commercial paper programme, and
€1,226million and US$309 million were drawn under the euro commercial paper programme.
2 At 31 March 2012 the amount includes £980 million (2011: £531 million) in relation to cash received under
collateral support agreements.
3 Comprises i) mark-to-market adjustments on derivative nancial instruments which are included as a
component of trade and other receivables (2012: £2,959 million; 2011: £2,045 million) and trade and other
payables (2012: £889 million; 2011: £548 million) and ii) short-term investments primarily in index linked
government bonds included as a component of other investments (2012: £987 million; 2011: £674 million).
At 31 March 2012 we had £7,138 million of cash and cash equivalents
which are held in accordance with our treasury policy.
We hold cash and liquid investments in accordance with the
counterparty and settlement risk limits of the Board approved
treasurypolicy. The main forms of liquid investment at 31 March 2012
were money market funds, UK index linked government bonds and
bankdeposits.
Net debt decreased by £5.4 billion to £24.4 billion primarily due to
cashgenerated by operations, the proceeds from the sale of the Group’s
44% interest in SFR and 24.4% interest in Polkomtel, and the £2.9 billion
income dividend from Verizon Wireless, partially offset by share
buybacks and dividend payments to equity holders.
Net debt represented 28.6% of our market capitalisation at 31 March
2012 compared to 32.8% at 31 March 2011. Average net debt at month
end accounting dates over the 12 month period ended 31 March 2012
was £25.6 billion and ranged between £22.3 billion and £29.6 billion
during the year.
The cash received from collateral support agreements mainly reects
the value of our interest rate swap portfolio which is substantially
netpresent value positive. See note 21 to the consolidated nancial
statements for further details on these agreements.
Commercial paper programmes
We currently have US and euro commercial paper programmes of
US$15 billion and £5 billion respectively which are available to be
usedto meet short-term liquidity requirements. At 31 March 2012
amounts external to the Group of €1,226 million (£1,022 million) and
US$309million (£193 million) were drawn under the euro commercial
paper programme and US$1,689 million (£1,056 million) was drawn
down under the US commercial paper programme, with such funds
being provided by counterparties externalto the Group. At 31 March
2011 €1,490 million (£1,317 million) was drawn under the euro
commercial paper programme and US$551million (£343 million) was
drawn under the US commercial paper programme. The commercial
paper facilities were supported by US$4.2 billion (£2.7 billion) and
€4.2billion (£3.5 billion) of syndicated committed bank facilities (see
“Committed facilities”). No amounts had been drawn under either
bankfacility.
Bonds
We have a €30 billion euro medium-term note programme and a
USshelf programme which are used to meet medium- to long-term
funding requirements. At 31 March 2012 the total amounts in issue
under these programmes split by currency were US$13.3 billion,
£2.5billion, €8.9billion and £0.2 billion sterling equivalent of
othercurrencies.
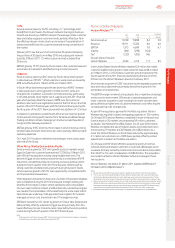
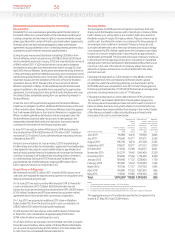
In the year ended 31 March 2012 bonds with a nominal value equivalent
of £0.7 billion at the relevant 31 March 2012 foreign exchange rates
were issued under the US shelf and the euro medium-term note
programme. The bonds issued during the year were:
Date of bond issue Maturity of bond
Nominal
amount
Million
Sterling
equivalent
Million
22 August 2011 22 August 2012 US$100 65
20 March 2012 20 March 2017 US$1,000 625
On 11 July 2011 we also raised US$850 million (£543 million) through
aUS private placement with a maturity of 11 July 2016.
At 31 March 2012 we had bonds outstanding with a nominal value of
£18,333 million (2011: £20,987 million).