Vodafone 2012 Annual Report Download - page 133
Download and view the complete annual report
Please find page 133 of the 2012 Vodafone annual report below. You can navigate through the pages in the report by either clicking on the pages listed below, or by using the keyword search tool below to find specific information within the annual report.-
 1
1 -
2
-
3
-
4
-
5
-
6
-
7
-
8
-
9
-
10
-
11
-
12
-
13
-
14
-
15
-
16
-
17
-
18
-
19
-
20
-
21
-
22
-
23
-
24
-
25
-
26
-
27
-
28
-
29
-
30
-
31
-
32
-
33
-
34
-
35
-
36
-
37
-
38
-
39
-
40
-
41
-
42
-
43
-
44
-
45
-
46
-
47
-
48
-
49
-
50
-
51
-
52
-
53
-
54
-
55
-
56
-
57
-
58
-
59
-
60
-
61
-
62
-
63
-
64
-
65
-
66
-
67
-
68
-
69
-
70
-
71
-
72
-
73
-
74
-
75
-
76
-
77
-
78
-
79
-
80
-
81
-
82
-
83
-
84
-
85
-
86
-
87
-
88
-
89
-
90
-
91
-
92
-
93
-
94
-
95
-
96
-
97
-
98
-
99
-
100
-
101
-
102
-
103
-
104
-
105
-
106
-
107
-
108
-
109
-
110
-
111
-
112
-
113
-
114
-
115
-
116
-
117
-
118
-
119
-
120
-
121
-
122
-
 123
123 -
 124
124 -
 125
125 -
 126
126 -
 127
127 -
 128
128 -
 129
129 -
 130
130 -
 131
131 -
 132
132 -
 133
133 -
 134
134 -
 135
135 -
 136
136 -
 137
137 -
 138
138 -
 139
139 -
 140
140 -
 141
141 -
 142
142 -
 143
143 -
144
-
145
-
146
-
147
-
148
-
149
-
150
-
151
-
152
-
153
-
154
-
155
-
156
-
157
-
158
-
159
-
160
-
161
-
162
-
163
-
164
-
165
-
166
-
167
-
168
-
169
-
170
-
171
-
172
-
173
-
174
-
175
-
176
 |
 |

Business review Performance Governance Financials Additional information
131
Vodafone Group Plc
Annual Report 2012
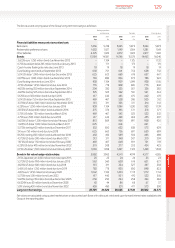
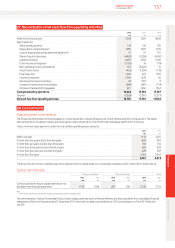
Interest rate and currency of borrowings
Total Floating rate Fixed rate Other
borrowings borrowings borrowings1borrowings2
Currency £m £m £m £m
Sterling 2,838 912 1,926 –
Euro 10,696 4,408 6,288 –
US dollar 14,085 4,521 9,495 69
Japanese yen 23 23 – –
Other 6,978 3,489 2,718 771
31 March 2012 34,620 13,353 20,427 840
Sterling 2,831 906 1,925 –
Euro 12,361 4,198 8,163 –
US dollar 16,030 9,488 3,352 3,190
Japanese yen 807 807 – –
Other 6,252 2,920 3,332 –
31 March 2011 38,281 18,319 16,772 3,190
Notes:
1 The weighted average interest rate for the Group’s sterling denominated xed rate borrowings is 5.7% (2011: 5.7%). The weighted average time for which these rates are xed is 4.5 years (2011: 5.4 years). The weighted average
interest rate for the Group’s euro denominated xed rate borrowings is 4.2% (2011: 4.3%). The weighted average time for which the rates are xed is 2.8 years (2011:3.8 years). The weighted average interest rate for the Group’s
US dollar denominated xedrate borrowings is 5.1% (2011: 5.4%). The weighted average time for which the rates are xed is 10.0 years (2011: 9.7 years). The weighted average interest rate for the Group’s other currency xed
rate borrowings is 10.1% (2011: 9.2%). The weighted average time for which the rates are xed is 2.7 years (2011: 2.0 years).
2 Other borrowings of £840million (2011: £3,190million) are the liabilities arising under options over direct and indirect interests in Vodafone India.
The gures shown in the tables above take into account interest rate swaps used tomanage the interest rate prole of nancial liabilities. Interest on
oating rate borrowings is generally based on national LIBOR equivalents or government bond rates in the relevant currencies.
At 31 March 2012 the Group had entered into foreign exchange contracts to decrease its sterling and other currency borrowings above by
£5,783million and £590million respectively, and to increase its euro, US dollar and Japanese yen currency borrowings above by amounts equal to
£2,180million, £1,970million and £2,184million respectively.
At 31 March 2011 the Group had entered into foreign exchange contracts to decrease its sterling, US dollar and other currency borrowings above by
£10,198million and amounts equal to £374million and £105million respectively, and to increase its euro and Japanese yen currency borrowings
above by amounts equal to £8,590million and £2,141million respectively.
Further protection from euro and US dollar interest rate movements is provided by interest rate swaps. At 31 March 2012 the Group had euro
denominated interest rate swaps covering the period from June 2012 to June 2016 for an amount equal to £685 million. US dollar denominated
interest swaps provide cover for the periods March 2012 to June 2012, June 2012 to September 2015, September 2015 to March 2016 and
March2016 to June 2016 for amounts equal to £653 million, £1,894 million, £1,241 million and £914 million respectively. Additionally US dollar
denominated interest rate swaps reduce the level of xed rate debt during the periods June 2016 to December 2019 by an amount equal to
£327million and sterling interest rate swaps reduce the level of xed debt during the periods December 2016 to December 2017 and December
2017 to December 2018 by amounts of £1,050 million and £450 million respectively.
At 31 March 2011 further protection from euro and US dollar interest rate movements was provided by interest rate swaps. The Group had
eurodenominated interest rate swaps covering periods June 2015 to December 2015 equal to £833 million. US dollar denominated interest
swapscoverthe period March 2011 to December 2011 and December 2011 to December 2015 for amounts equal to £1,282 million and
£641million respectively.
The Group has entered into euro and US dollar denominated interest rate futures. The euro denominated interest rate futures provide cover for the
periods March 2012 to June 2012, June 2012 to September 2012, September 2012 to December 2012, December 2012 to March 2013, March 2013
to June 2013, June 2013 to September 2013, September 2013 to December 2013, December 2013 to March 2014, June 2014 to December 2014,
December 2014 to March 2015, March 2015 to June 2015, June 2015 to September 2015, September 2015 to December 2015, December 2015 to
March 2016, March 2016 to June 2016, June 2016 to September 2016 and September 2016 to December 2016 for amounts equal to £7,435 million,
£422 million, £976 million, £1,806 million, £1,640 million, £1,391 million, £2,076 million, £2,326 million, £3,738 million, £831 million, £2,396 million,
£3,472 million, £2,650 million, £1,819 million, £154 million, £3,196 million and £328 million respectively. The US dollar denominated interest rate
futures cover the periods March 2014 to June 2014, December 2015 to March 2016, March 2016 to June 2016, June 2016 to September 2016,
September 2016 to December 2016 and December 2016 to March 2017 for amounts equal to £653 million, £3,060 million, £2,505 million,
£2,351million, £1,988 million and £1,976 million respectively.
At 31 March 2011 the Group had entered into euro and US dollar denominated interest rate futures. The euro denominated interest rate futures
covered the periods September 2011 to December 2011, December 2011 to March 2012, March 2012 to June 2012 and June 2012 to September
2012 for amounts equal to £2,083 million, £833 million, £7,185 million and £6,811 million respectively. Additional cover was provided for the period
March 2013 to March 2014 and March 2015 to March 2016 for average amounts for each period equal to £2,006 million and £2,331 million
respectively. The US dollar denominated interest rate futures covered the periods June 2011 to September 2011, June 2013 to September 2013
andSeptember 2013 to December 2013 for amounts equal to £3,601 million, £1,923 million and £833 million respectively.
The Group has entered into interest rate swaps to alter the level of protection against interest rate movements during future periods. US dollar
interest rate futures reduce the level of xed debt during the periods March 2012 to June 2012, June 2012 to September 2012, September 2012 to
December 2012, December 2012 to September 2013, September 2013 to December 2013, June 2015 to September 2015 and September 2015 to
December 2015 for amounts equal to £1,894 million, £1,306 million, £9,494 million, £3,919 million, £3,070 million, £4,385 million and £2,133 million
respectively. Additionally sterling interest rate futures reduced xed debt in the periods March 2012 to June 2012 and December 2013 to March
2014 by amounts of £7,289 million and £667 million respectively.