Vodafone 2012 Annual Report Download - page 45
Download and view the complete annual report
Please find page 45 of the 2012 Vodafone annual report below. You can navigate through the pages in the report by either clicking on the pages listed below, or by using the keyword search tool below to find specific information within the annual report.-
 1
1 -
2
-
3
-
4
-
5
-
6
-
7
-
8
-
9
-
10
-
11
-
12
-
13
-
14
-
15
-
16
-
17
-
18
-
19
-
20
-
21
-
22
-
23
-
24
-
25
-
26
-
27
-
28
-
29
-
30
-
31
-
32
-
33
-
34
-
 35
35 -
 36
36 -
 37
37 -
 38
38 -
 39
39 -
 40
40 -
 41
41 -
 42
42 -
 43
43 -
 44
44 -
 45
45 -
 46
46 -
 47
47 -
 48
48 -
 49
49 -
 50
50 -
 51
51 -
 52
52 -
 53
53 -
 54
54 -
 55
55 -
56
-
57
-
58
-
59
-
60
-
61
-
62
-
63
-
64
-
65
-
66
-
67
-
68
-
69
-
70
-
71
-
72
-
73
-
74
-
75
-
76
-
77
-
78
-
79
-
80
-
81
-
82
-
83
-
84
-
85
-
86
-
87
-
88
-
89
-
90
-
91
-
92
-
93
-
94
-
95
-
96
-
97
-
98
-
99
-
100
-
101
-
102
-
103
-
104
-
105
-
106
-
107
-
108
-
109
-
110
-
111
-
112
-
113
-
114
-
115
-
116
-
117
-
118
-
119
-
120
-
121
-
122
-
123
-
124
-
125
-
126
-
127
-
128
-
129
-
130
-
131
-
132
-
133
-
134
-
135
-
136
-
137
-
138
-
139
-
140
-
141
-
142
-
143
-
144
-
145
-
146
-
147
-
148
-
149
-
150
-
151
-
152
-
153
-
154
-
155
-
156
-
157
-
158
-
159
-
160
-
161
-
162
-
163
-
164
-
165
-
166
-
167
-
168
-
169
-
170
-
171
-
172
-
173
-
174
-
175
-
176
 |
 |

Business review Performance Governance Financials Additional information
43
Vodafone Group Plc
Annual Report 2012
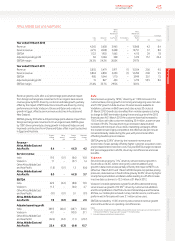
Africa, Middle East and Asia Pacic
India
£m
Vodacom
£m
Other
Africa,
Middle East
and
Asia Pacic
£m
Eliminations
£m
Africa,
Middle East
and Asia
Pacic
£m
% change
£m Organic
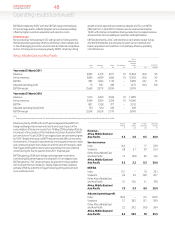
Year ended 31 March 2012
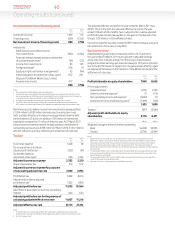
Revenue 4,265 5,638 3,965 – 13,868 4.2 8.4
Service revenue 4,215 4,908 3,628 – 12,751 3.7 8.0
EBITDA 1,122 1,930 1,063 – 4,115 2.9 7.8
Adjusted operating prot 60 1,084 328 – 1,472 15.7 22.4
EBITDA margin 26.3% 34.2% 26.8% 29.7%
Year ended 31 March 2011
Revenue 3,855 5,479 3,971 (1) 13,304 20.0 9.5
Service revenue 3,804 4,839 3,650 (1) 12,292 20.0 9.5
EBITDA 985 1,844 1,170 – 3,999 20.7 7.5
Adjusted operating prot 15 827 430 – 1,272 55.5 8.6
EBITDA margin 25.6% 33.7% 29.5% 30.1%
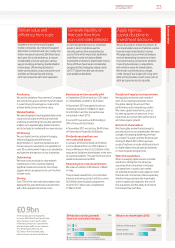
Revenue grew by 4.2% after a 4.2 percentage point adverse impact
from foreign exchange rate movements. On an organic basis service
revenue grew by 8.0%* driven by customer and data growth, partially
offset by the impact of MTR reductions. Growth was driven by strong
performances in India, Vodacom, Ghana and Qatar and a return to
growth in Egypt, offset by service revenue declines in Australia and
NewZealand.
EBITDA grew by 2.9% after a 4.8 percentage point adverse impact from
foreign exchange rate movements. On an organic basis, EBITDA grew
by7.8%* driven primarily by strong growth in India and Vodacom and
improved contributions from Ghana and Qatar, offset in part by declines
in Egypt and Australia.
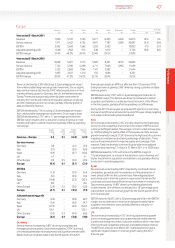
Organic
change
%
Other
activity1
pps
Foreign
exchange
pps
Reported
change
%
Revenue –
Africa, Middle East and
Asia Pacic 8.4 –(4.2) 4.2
Service revenue
India 19.5 (0.1) (8.6) 10.8
Vodacom 7.1 – (5.7) 1.4
Other Africa, Middle East
and Asia Pacic (1.8) (0.1) 1.3 (0.6)
Africa, Middle East and
Asia Pacic 8.0 –(4.3) 3.7
EBITDA
India 22.9 (0.2) (8.8) 13.9
Vodacom 11.3 – (6.6) 4.7
Other Africa, Middle East
and Asia Pacic (9.1) (0.1) 0.1 (9.1)
Africa, Middle East and
Asia Pacic 7.8 (0.1) (4.8) 2.9
Adjusted operating prot
India 389.3 (40.6) (48.7) 300.0
Vodacom 41.1 – (10.0) 31.1
Other Africa, Middle East
and Asia Pacic (22.4) (0.2) (1.1) (23.7)
Africa, Middle East and
Asia Pacic 22.4 (0.3) (6.4) 15.7
India
Service revenue grew by 19.5%,* driven by an 11.8% increase in the
customer base, strong growth in incoming and outgoing voice minutes
and 51.3%* growth in data revenue. 3G services were available to
Vodafone customers in 860 towns and cities across 20 circles at
31March 2012. Growth also beneted from mobile operators starting
tocharge for SMS termination during the second quarter of the 2012
nancial year. At 31 March 2012 the customer base had increased to
150.5 million, with data customers totalling 35.4 million, a year-on-year
increase of 81.5%. This was driven by an increase in data enabled
handsets and the impact of successful marketing campaigns. Whilst
themarket remains highly competitive, the effective rate per minute
remained broadly stable during the year, with promotional offers
offsetting headline price increases.
EBITDA grew by 22.9%* driven by the increase in revenue and
economies of scale, partially offset by higher customer acquisition costs
and increased interconnection costs. Full year EBITDA margin increased
0.8* percentage points to 26.3%, driven by cost efciencies and scale
benets.
Vodacom
Service revenue grew by 7.1%,* driven by service revenue growth in
South Africa of 4.4%*, where strong net customer additions and
growthin data revenue was partially offset by the impact of MTR cuts
(effective 1 March 2011 and 1 March 2012). Despite competitive pricing
pressures,data revenue in South Africa grew by 24.3%,* driven by higher
smartphone penetration and data bundles leading to a 35.4% increase
in active data customers to 12.2 million at 31 March 2012.
Vodacom’s mobile operations outside South Africa delivered strong
service revenue growth of 31.9%*2, driven by customer net additions
and the simplication of tariff structures in Mozambique and Tanzania.
M-Pesa, our mobile phone based money transfer service, continues to
perform well in Tanzania with over 3.1 million active users.
EBITDA increased by 11.3%* driven by robust service revenue growth
and continued focus on operating cost efciencies.
Notes:
1 “Other activity” includes the impact of M&A activity and the revision to intra-group roaming charges from
1October 2012. Refer to “Organic growth” on page 171 for further detail.
2 Excludes Gateway and Vodacom Business Africa.