Vodafone 2012 Annual Report Download - page 131
Download and view the complete annual report
Please find page 131 of the 2012 Vodafone annual report below. You can navigate through the pages in the report by either clicking on the pages listed below, or by using the keyword search tool below to find specific information within the annual report.-
 1
1 -
2
-
3
-
4
-
5
-
6
-
7
-
8
-
9
-
10
-
11
-
12
-
13
-
14
-
15
-
16
-
17
-
18
-
19
-
20
-
21
-
22
-
23
-
24
-
25
-
26
-
27
-
28
-
29
-
30
-
31
-
32
-
33
-
34
-
35
-
36
-
37
-
38
-
39
-
40
-
41
-
42
-
43
-
44
-
45
-
46
-
47
-
48
-
49
-
50
-
51
-
52
-
53
-
54
-
55
-
56
-
57
-
58
-
59
-
60
-
61
-
62
-
63
-
64
-
65
-
66
-
67
-
68
-
69
-
70
-
71
-
72
-
73
-
74
-
75
-
76
-
77
-
78
-
79
-
80
-
81
-
82
-
83
-
84
-
85
-
86
-
87
-
88
-
89
-
90
-
91
-
92
-
93
-
94
-
95
-
96
-
97
-
98
-
99
-
100
-
101
-
102
-
103
-
104
-
105
-
106
-
107
-
108
-
109
-
110
-
111
-
112
-
113
-
114
-
115
-
116
-
117
-
118
-
119
-
120
-
 121
121 -
 122
122 -
 123
123 -
 124
124 -
 125
125 -
 126
126 -
 127
127 -
 128
128 -
 129
129 -
 130
130 -
 131
131 -
 132
132 -
 133
133 -
 134
134 -
 135
135 -
 136
136 -
 137
137 -
 138
138 -
 139
139 -
 140
140 -
 141
141 -
142
-
143
-
144
-
145
-
146
-
147
-
148
-
149
-
150
-
151
-
152
-
153
-
154
-
155
-
156
-
157
-
158
-
159
-
160
-
161
-
162
-
163
-
164
-
165
-
166
-
167
-
168
-
169
-
170
-
171
-
172
-
173
-
174
-
175
-
176
 |
 |

Business review Performance Governance Financials Additional information
129
Vodafone Group Plc
Annual Report 2012
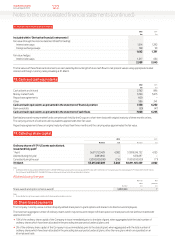
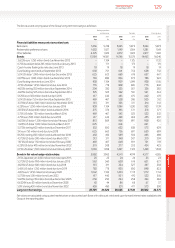
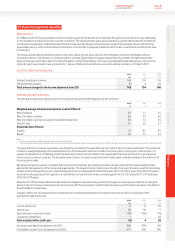
The fair value and carrying value of the Group’s long-term borrowings is as follows:
Sterling equivalent
nominal value Fair value Carrying value
2012 2011 2012 2011 2012 2011
£m £m £m £m £m £m
Financial liabilities measured at amortised cost:
Bank loans 5,336 5,728 5,625 5,872 5,624 5,873
Redeemable preference shares 1,032 1,027 1,199 1,054 1,281 1,169
Other liabilities 2,325 1,022 2,472 1,023 2,417 1,022
Bonds: 13,184 14,581 14,746 15,578 14,463 16,046
3.625% euro 1,250million bond due November 2012 – 1,104 – 1,125 – 1,132
6.75% Australian dollar 265million bond due January 2013 – 171 – 173 – 176
Czech kurona oating rate note due June 2013 18 19 18 19 18 19
Euro oating rate note due September 2013 638 751 641 752 638 752
5.0% US dollar 1,000million bond due December 2013 625 623 669 676 657 667
6.875% euro 1,000million bond due December 2013 763 883 834 970 786 922
Euro oating rate note due June 2014 938 1,104 939 1,099 938 1,105
4.15% US dollar 1,250million bond due June 2014 755 778 808 826 773 802
4.625% sterling 350million bond due September 2014 304 350 325 367 326 382
4.625% sterling 525million bond due September 2014 525 525 562 551 541 544
5.125% euro 500million bond due April 2015 417 442 463 475 442 470
5.0% US dollar 750million bond due September 2015 469 467 528 506 505 512
3.375% US dollar 500million bond due November 2015 313 311 335 317 314 312
6.25% euro 1,250million bond due January 2016 938 1,104 1,094 1,230 953 1,139
2.875% US dollar 600million bond due March 2016 375 374 393 371 374 371
5.75% US dollar 750million bond due March 2016 469 467 543 523 522 532
4.75% euro 500million bond due June 2016 417 442 469 463 455 487
5.625% US dollar 1,300million bond due February 2017 813 809 954 897 908 920
1.625% US dollar 1,000million bond due March 2017 625 – 624 – 621 –
5.375% sterling 600million bond due December 2017 552 600 632 638 573 629
5% euro 750million bond due June 2018 625 663 726 697 650 689
8.125% sterling 450million bond due November 2018 450 450 589 550 485 488
4.375% US dollar 500million bond due March 2021 313 311 348 307 310 309
7.875% US dollar 750million bond due February 2030 469 467 648 591 751 759
6.25% US dollar 495million bond due November 2032 310 308 377 332 424 425
6.15% US dollar 1,700million bond due February 2037 1,063 1,058 1,227 1,123 1,499 1,503
Bonds in fair value hedge relationships: 3,882 3,962 4,541 4,199 4,577 4,265
2.15% Japanese yen 3,000million bond due April 2015 23 23 24 24 23 23
5.375% US dollar 900million bond due January 2015 563 560 628 616 621 621
4.625% US dollar 500million bond due July 2018 313 311 354 327 367 338
5.45% US dollar 1,250million bond due June 2019 782 778 920 850 898 823
4.65% euro 1,250million bond January 2022 1,042 1,104 1,203 1,115 1,172 1,114
5.375% euro 500million bond June 2022 417 442 501 470 532 505
5.625% sterling 250million bond due December 2025 250 250 294 258 324 284
6.6324% euro 50million bond due December 2028 42 44 86 68 67 57
5.9% sterling 450million bond due November 2032 450 450 531 471 573 500
Long-term borrowings 25,759 26,320 28,583 27,726 28,362 28,375
Fair values are calculated using quoted market prices or discounted cash ows with a discount rate based upon forward interest rates available to the
Group at the reporting date.