Vodafone 2012 Annual Report Download - page 126
Download and view the complete annual report
Please find page 126 of the 2012 Vodafone annual report below. You can navigate through the pages in the report by either clicking on the pages listed below, or by using the keyword search tool below to find specific information within the annual report.-
 1
1 -
2
-
3
-
4
-
5
-
6
-
7
-
8
-
9
-
10
-
11
-
12
-
13
-
14
-
15
-
16
-
17
-
18
-
19
-
20
-
21
-
22
-
23
-
24
-
25
-
26
-
27
-
28
-
29
-
30
-
31
-
32
-
33
-
34
-
35
-
36
-
37
-
38
-
39
-
40
-
41
-
42
-
43
-
44
-
45
-
46
-
47
-
48
-
49
-
50
-
51
-
52
-
53
-
54
-
55
-
56
-
57
-
58
-
59
-
60
-
61
-
62
-
63
-
64
-
65
-
66
-
67
-
68
-
69
-
70
-
71
-
72
-
73
-
74
-
75
-
76
-
77
-
78
-
79
-
80
-
81
-
82
-
83
-
84
-
85
-
86
-
87
-
88
-
89
-
90
-
91
-
92
-
93
-
94
-
95
-
96
-
97
-
98
-
99
-
100
-
101
-
102
-
103
-
104
-
105
-
106
-
107
-
108
-
109
-
110
-
111
-
112
-
113
-
114
-
115
-
 116
116 -
 117
117 -
 118
118 -
 119
119 -
 120
120 -
 121
121 -
 122
122 -
 123
123 -
 124
124 -
 125
125 -
 126
126 -
 127
127 -
 128
128 -
 129
129 -
 130
130 -
 131
131 -
 132
132 -
 133
133 -
 134
134 -
 135
135 -
 136
136 -
137
-
138
-
139
-
140
-
141
-
142
-
143
-
144
-
145
-
146
-
147
-
148
-
149
-
150
-
151
-
152
-
153
-
154
-
155
-
156
-
157
-
158
-
159
-
160
-
161
-
162
-
163
-
164
-
165
-
166
-
167
-
168
-
169
-
170
-
171
-
172
-
173
-
174
-
175
-
176
 |
 |

124
Vodafone Group Plc
Annual Report 2012
Notes to the consolidated nancial statements (continued)
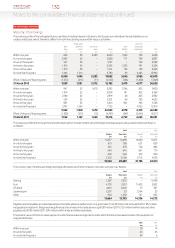
20. Share-based payments (continued)
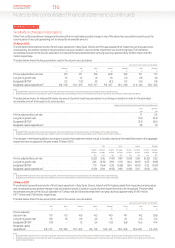
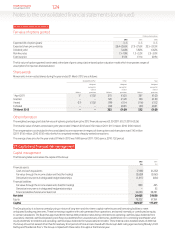
Fair value of options granted
Ordinary share options
2012 2011 2010
Expected life of option (years) 3–5 3–5 3–5
Expected share price volatility 25.4–25.6% 27.5–27.6% 32.5–33.5%
Dividend yield 5.44% 5.82% 6.62%
Risk free rates 1.1–1.9% 1.3–2.2% 2.5–3.0%
Exercise price £1.31 £1.14 £0.94
The fair value of options granted is estimated at the date of grant using a lattice-based option valuation model which incorporates ranges of
assumptions for inputs as disclosed above.
Share awards
Movements in non-vested shares during the year ended 31 March 2012 are as follows:
Global AllShare Plan Other Total
Weighted Weighted Weighted
average fair average fair average fair
value at value at value at
Millions grant date Millions grant date Millions grant date
1 April 2011 17 £1.02 370 £1.00 387 £1.00
Granted – – 120 £1.29 120 £1.29
Vested (17) £1.02 (99) £1.14 (116) £1.12
Forfeited – – (39) £0.81 (39) £0.81
31 March 2012 – – 352 £1.08 352 £1.08
Other information
The weighted average grant date fair value of options granted during the 2012 nancial year was £0.30 (2011: £0.27; 2010: £0.26).
The total fair value of shares vested during the year ended 31 March 2012 was £130million (2011: £113million; 2010: £100million).
The compensation cost included in the consolidated income statement in respect of share options and share plans was £143million
(2011:£156million; 2010: £150million) which is comprised entirely of equity-settled transactions.
The average share price for the year ended 31 March 2012 was 169.9 pence (2011: 159.5 pence, 2010: 132 pence).
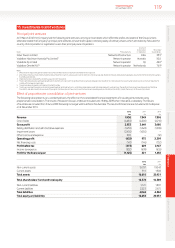
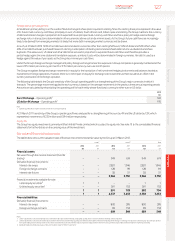
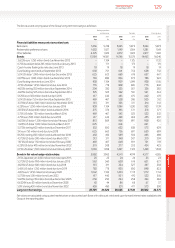
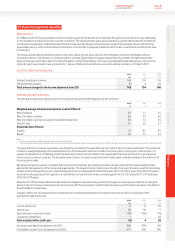
21. Capital and nancial risk management
Capital management
The following table summarises the capital of the Group:
2012 2011
£m £m
Financial assets:
Cash and cash equivalents (7,138) (6,252)
Fair value through the income statement (held for trading) (2,629) (2,065)
Derivative instruments in designated hedge relationships (1,317) (654)
Financial liabilities:
Fair value through the income statements (held for trading) 889 495
Derivative instruments in designated hedge relationships – 53
Financial liabilities held at amortised cost 34,620 38,281
Net debt 24,425 29,858
Equity 78,202 87,561
Capital 102,627 117,419
The Group’s policy is to borrow centrally using a mixture of long-term and short-term capital market issues and borrowing facilities to meet
anticipated funding requirements. These borrowings, together with cash generated from operations, are loaned internally or contributed as equity
tocertain subsidiaries. The Board has approved three internal debt protection ratios being: net interest to operating cash ow (plus dividends from
associates); retained cash ow (operating cash ow plus dividends from associates less interest, tax, dividends to non-controlling shareholders and
equity dividends) to net debt; and operating cash ow (plus dividends from associates) to net debt. These internal ratios establish levels of debt that
the Group should not exceed other than for relatively short periods of time and are shared with the Group’s debt rating agencies being Moody’s, Fitch
Ratings and Standard & Poor’s. The Group complied with these ratios throughout the nancial year.