Vodafone 2012 Annual Report Download - page 8
Download and view the complete annual report
Please find page 8 of the 2012 Vodafone annual report below. You can navigate through the pages in the report by either clicking on the pages listed below, or by using the keyword search tool below to find specific information within the annual report.-
 1
1 -
 2
2 -
 3
3 -
 4
4 -
 5
5 -
 6
6 -
 7
7 -
 8
8 -
 9
9 -
 10
10 -
 11
11 -
 12
12 -
 13
13 -
 14
14 -
 15
15 -
 16
16 -
 17
17 -
 18
18 -
 19
19 -
20
-
21
-
22
-
23
-
24
-
25
-
26
-
27
-
28
-
29
-
30
-
31
-
32
-
33
-
34
-
35
-
36
-
37
-
38
-
39
-
40
-
41
-
42
-
43
-
44
-
45
-
46
-
47
-
48
-
49
-
50
-
51
-
52
-
53
-
54
-
55
-
56
-
57
-
58
-
59
-
60
-
61
-
62
-
63
-
64
-
65
-
66
-
67
-
68
-
69
-
70
-
71
-
72
-
73
-
74
-
75
-
76
-
77
-
78
-
79
-
80
-
81
-
82
-
83
-
84
-
85
-
86
-
87
-
88
-
89
-
90
-
91
-
92
-
93
-
94
-
95
-
96
-
97
-
98
-
99
-
100
-
101
-
102
-
103
-
104
-
105
-
106
-
107
-
108
-
109
-
110
-
111
-
112
-
113
-
114
-
115
-
116
-
117
-
118
-
119
-
120
-
121
-
122
-
123
-
124
-
125
-
126
-
127
-
128
-
129
-
130
-
131
-
132
-
133
-
134
-
135
-
136
-
137
-
138
-
139
-
140
-
141
-
142
-
143
-
144
-
145
-
146
-
147
-
148
-
149
-
150
-
151
-
152
-
153
-
154
-
155
-
156
-
157
-
158
-
159
-
160
-
161
-
162
-
163
-
164
-
165
-
166
-
167
-
168
-
169
-
170
-
171
-
172
-
173
-
174
-
175
-
176
 |
 |

06
Vodafone Group Plc
Annual Report 2012
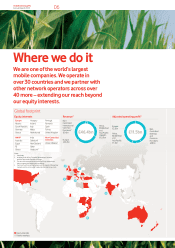
n Equity interests
n Partner markets
6
4
1
2
3
75
Notes:
1 Associates.
2 Includes South Africa, Tanzania, Mozambique, Lesotho
andtheDemocratic Republic of Congo.
3 The sum of these amounts do not equal Group totals due to
inter-company eliminations and roundings.
4 Common Functions primarily represent the results of the partner
markets and the net result of unallocated central Group costs.
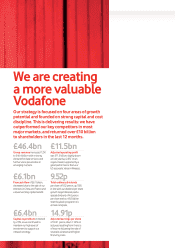
Revenue3
Non-
Controlled
Interests and
Common
Functions:
4
£0.4bn £46.4bn
Africa,
Middle East
and
Asia Pacic
(‘AMAP’):
£13.9bn
Europe:
£32.2bn
Adjusted operating prot3
Europe:
£5.3bn £11.5bn Non-
Controlled
Interests
and
Common
Functions:
£4.8bn
Africa,
Middle East
and
Asia Pacic:
£1.5bn
Europe
Albania
Czech Republic
Germany
Greece
Hungary
Ireland
Italy
Malta
Netherlands
Portugal
Romania
Spain
Turkey
United Kingdom
AMAP
Australia
Egypt
Fiji
Ghana
India
Safaricom1
New Zealand
Qatar
Vodacom2
Non-Controlled
Interests
Verizon Wireless1
Global footprint
Equity interests
Where we do it
We are one of the world’s largest
mobilecompanies. We operate in
over30countries and we partner with
other network operators across over
40more– extending our reach beyond
our equity interests.