Vodafone 2012 Annual Report Download - page 56
Download and view the complete annual report
Please find page 56 of the 2012 Vodafone annual report below. You can navigate through the pages in the report by either clicking on the pages listed below, or by using the keyword search tool below to find specific information within the annual report.-
 1
1 -
2
-
3
-
4
-
5
-
6
-
7
-
8
-
9
-
10
-
11
-
12
-
13
-
14
-
15
-
16
-
17
-
18
-
19
-
20
-
21
-
22
-
23
-
24
-
25
-
26
-
27
-
28
-
29
-
30
-
31
-
32
-
33
-
34
-
35
-
36
-
37
-
38
-
39
-
40
-
41
-
42
-
43
-
44
-
45
-
 46
46 -
 47
47 -
 48
48 -
 49
49 -
 50
50 -
 51
51 -
 52
52 -
 53
53 -
 54
54 -
 55
55 -
 56
56 -
 57
57 -
 58
58 -
 59
59 -
 60
60 -
 61
61 -
 62
62 -
 63
63 -
 64
64 -
 65
65 -
 66
66 -
67
-
68
-
69
-
70
-
71
-
72
-
73
-
74
-
75
-
76
-
77
-
78
-
79
-
80
-
81
-
82
-
83
-
84
-
85
-
86
-
87
-
88
-
89
-
90
-
91
-
92
-
93
-
94
-
95
-
96
-
97
-
98
-
99
-
100
-
101
-
102
-
103
-
104
-
105
-
106
-
107
-
108
-
109
-
110
-
111
-
112
-
113
-
114
-
115
-
116
-
117
-
118
-
119
-
120
-
121
-
122
-
123
-
124
-
125
-
126
-
127
-
128
-
129
-
130
-
131
-
132
-
133
-
134
-
135
-
136
-
137
-
138
-
139
-
140
-
141
-
142
-
143
-
144
-
145
-
146
-
147
-
148
-
149
-
150
-
151
-
152
-
153
-
154
-
155
-
156
-
157
-
158
-
159
-
160
-
161
-
162
-
163
-
164
-
165
-
166
-
167
-
168
-
169
-
170
-
171
-
172
-
173
-
174
-
175
-
176
 |
 |

54
Vodafone Group Plc
Annual Report 2012
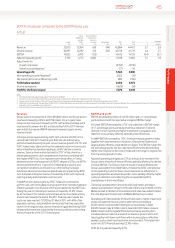
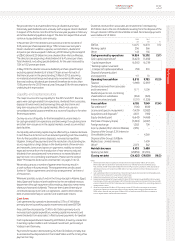
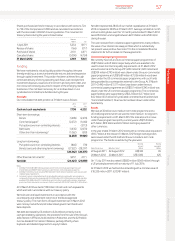
Consolidated statement of nancial position
2012 2011
£m £m
Non-current assets
Intangible assets 59,514 68,558
Property, plant and equipment 18,655 20,181
Investments in associates 35,108 38,105
Other non-current assets 6,274 7,373
119,551 134,217
Current assets 20,025 17,003
Total assets 139,576 151,220
Total equity shareholders’ funds 76,935 87,555
Total non-controlling interests 1,267 6
Total equity 78,202 87,561
Liabilities
Borrowings
Long-term 28,362 28,375
Short-term 6,258 9,906
Taxation liabilities
Deferred tax liabilities 6,597 6,486
Current taxation liabilities 2,148 2,262
Other non-current liabilities 2,140 1,373
Other current liabilities 15,869 15,257
Total liabilities 61,374 63,659
Total equity and liabilities 139,576 151,220
Assets
Intangible assets
At 31 March 2012 our intangible assets were £59.5 billion (2011:
£68.6billion) with goodwill comprising the largest element at
£38.4billion (2011: £45.2 billion). The decrease primarily resulted
fromimpairment losses of £3.9 billion, amortisation of £3.5 billion and
unfavourable foreign exchange rate movements of £4.2 billion partially
offset by £2.9 billion of additions. Refer to note 10 to the consolidated
nancial statements for further information on the impairment charge.
Property, plant and equipment
Property, plant and equipment decreased to £18.7 billion at 31 March
2012 from £20.2 billion at 31March2011 predominantly as aresult of
£4.4 billion of depreciation charges and unfavourable foreign exchange
rate movements of£1.3billion partially offset by £4.7 billion of additions.
Investments in associates
Investments in associates decreased to £35.1 billion at 31 March 2012
from £38.1 billion at 31 March 2011 primarily due to a reduction of
£4.0billion in relation to the sale of our 44% interest in SFR and
£4.0billion of dividends received partially offset by our share of the
results of associates, after deductions of interest, tax and non-controlling
interest, which contributed £5.0 billion, mainly arising from our
investment in Verizon Wireless.
Other non-current assets
Other non-current assets decreased to £6.3 billion at 31 March 2012
(2011: £7.4 billion) mainly due to other investments which totalled
£0.8billion at 31 March 2012 compared to £1.4 billion at 31 March 2011.
Current assets
Current assets increased to £20.0 billion at 31 March 2012 from
£17.0billion at 31 March 2011 due to an increase in cash and short-term
investments resulting from the element of the proceeds from the
disposal of our 44% interest in SFR not yet utilised for the share buyback
programme, and an increase in other receivables due to the second
tranche of the proceeds from the sale of our interest in SoftBank Mobile
Corp. Limited which was received in April 2012.
Total equity and liabilities
Total equity
Total equity decreased to £78.2 billion at 31 March 2012 from £87.6
billion at 31March 2011. The prot for the year of £7.0 billion was more
than offset by equity dividends of £6.7 billion, other comprehensive loss
of £4.7 billion, share buyback of£4.7 billion and £1.9 billion in relation
tothe acquisition of non-controlling interests, primarily in India. Total
non-controlling interests have increased by £1.3 billion primarily as a
result of the exercise of put options over non-controlling interests during
the year.
Borrowings
Long-term borrowings and short-term borrowings decreased to
£34.6billion at 31 March 2012 from £38.3 billion at 31 March 2011
mainly as a result of foreign exchange rate movements, bond
repayments during the year and settlement of certain put options
heldby the Essar Group.
Taxation liabilities
Current tax liabilities decreased to £2.1 billion at 31 March 2012 from
£2.3 billion at 31 March 2011 mainly as a result of the resolution and
payment of longstanding tax disputes.
Other current liabilities
Other current liabilities increased to £15.9 billion at 31 March 2012
from£15.3 billion at 31 March 2011. Trade payables at 31 March 2012
were equivalent to 43 days (2011: 37 days) outstanding, calculated
byreference to the amount owed to suppliers as a proportion of the
amounts invoiced by suppliers during the year. It is our policy to agree
terms of transactions, including payment terms, with suppliers and it is
our normal practice that payment is made accordingly.
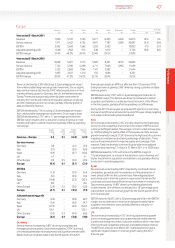
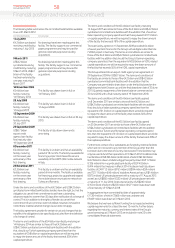
Contractual obligations and contingencies
A summary of our principal contractual nancial obligations is shown
below. Further details on the items included can be found in the
notestothe consolidated nancial statements. Details of the Group’s
contingent liabilities are included in note 29 to the consolidated
nancialstatements.
Payments due by period £m
Contractual obligations1Total <1 year 1-3 years 3-5 years >5 years
Borrowings242,079 6,266 11,419 10,400 13,994
Operating lease
commitments36,141 1,110 1,633 1,152 2,246
Capital
commitments3 4 2,018 1,798 195 25 –
Purchase
commitments 5,138 3,237 1,081 446 374
Total 55,376 12,411 14,328 12,023 16,614
Notes:
1 The above table of contractual obligations includes commitments in respect of options over interests
inGroup businesses held by non-controlling shareholders (see “Option agreements and similar
arrangements”) and obligations to pay dividends to non-controlling shareholders (see “Dividends from
associates and to non-controlling shareholders”). The table excludes current and deferred tax liabilities and
obligations under post employment benet schemes, details of which are provided in notes 6 and 23 to
theconsolidated nancial statements respectively. The table also excludes the contractual obligations
ofassociates.
2 See note 22 to the consolidated nancial statements.
3 See note 28 to the consolidated nancial statements.
4 Primarily related to network infrastructure.
Equity dividends
The table below sets out the amounts of interim, nal and total cash
dividends paid or, in the case of the nal dividend for the 2012 nancial
year, proposed, in respect of each nancial year.
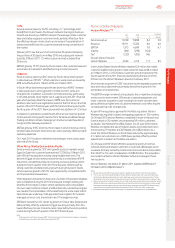
Pence per ordinary share
Year ended 31 March Interim Final Total
2008 2.49 5.02 7.51
2009 2.57 5.20 7.77
2010 2.66 5.65 8.31
2011 2.85 6.05 8.90
2012 7.0516.47213.52
Notes:
1 Includes the 4.0 pence special dividend paid in February 2012.
2 The nal dividend for the year ended 31 March 2012 was proposed on 22 May 2012 and is payable on
1August 2012 to holders on record as of 8 June 2012. For American depositary share (‘ADS’) holders
thedividend will be payable in US dollars under the terms of the ADS depositary agreement. Dividend
payments on ordinary shares will be paid by direct credit into a nominated bank or building society account
or, alternatively, into the Company’s dividend reinvestment plan.
Financial position and resources