Vodafone 2012 Annual Report Download - page 148
Download and view the complete annual report
Please find page 148 of the 2012 Vodafone annual report below. You can navigate through the pages in the report by either clicking on the pages listed below, or by using the keyword search tool below to find specific information within the annual report.-
 1
1 -
2
-
3
-
4
-
5
-
6
-
7
-
8
-
9
-
10
-
11
-
12
-
13
-
14
-
15
-
16
-
17
-
18
-
19
-
20
-
21
-
22
-
23
-
24
-
25
-
26
-
27
-
28
-
29
-
30
-
31
-
32
-
33
-
34
-
35
-
36
-
37
-
38
-
39
-
40
-
41
-
42
-
43
-
44
-
45
-
46
-
47
-
48
-
49
-
50
-
51
-
52
-
53
-
54
-
55
-
56
-
57
-
58
-
59
-
60
-
61
-
62
-
63
-
64
-
65
-
66
-
67
-
68
-
69
-
70
-
71
-
72
-
73
-
74
-
75
-
76
-
77
-
78
-
79
-
80
-
81
-
82
-
83
-
84
-
85
-
86
-
87
-
88
-
89
-
90
-
91
-
92
-
93
-
94
-
95
-
96
-
97
-
98
-
99
-
100
-
101
-
102
-
103
-
104
-
105
-
106
-
107
-
108
-
109
-
110
-
111
-
112
-
113
-
114
-
115
-
116
-
117
-
118
-
119
-
120
-
121
-
122
-
123
-
124
-
125
-
126
-
127
-
128
-
129
-
130
-
131
-
132
-
133
-
134
-
135
-
136
-
137
-
 138
138 -
 139
139 -
 140
140 -
 141
141 -
 142
142 -
 143
143 -
 144
144 -
 145
145 -
 146
146 -
 147
147 -
 148
148 -
 149
149 -
 150
150 -
 151
151 -
 152
152 -
 153
153 -
 154
154 -
 155
155 -
 156
156 -
 157
157 -
 158
158 -
159
-
160
-
161
-
162
-
163
-
164
-
165
-
166
-
167
-
168
-
169
-
170
-
171
-
172
-
173
-
174
-
175
-
176
 |
 |

146
Vodafone Group Plc
Annual Report 2012
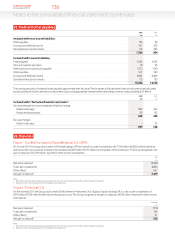
4. Debtors
2012 2011
£m £m
Amounts falling due within one year:
Amounts owed by subsidiaries 145,200 133,246
Taxation recoverable 207 158
Other debtors 177 146
145,584 133,550
Amounts falling due after more than one year:
Deferred taxation 2 2
Other debtors 2,441 1,754
2,443 1,756
5. Other investments
2012 2011
£m £m
Investments 49 64
6. Creditors
2012 2011
£m £m
Amounts falling due within one year:
Bank loans and other loans 4,576 4,739
Amounts owed to subsidiaries 94,432 89,194
Other creditors 127 166
Accruals and deferred income 1,136 52
100,271 94,151
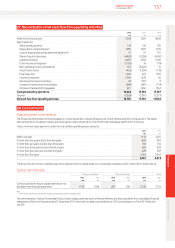
Amounts falling due after more than one year:
Other loans 20,821 21,367
Other creditors 763 393
21,584 21,760
Included in amounts falling due after more than one year are other loans of £9,326 million, which are due in more than ve years from 1 April 2012
and are payable otherwise than by instalments. Interest payable on these loans ranges from 4.375% to 8.125%.
7. Share capital
2012 2011
Number £m Number £m
Ordinary shares of 11 3⁄7 US cents each allotted, issued and
fully paid:1 2
1 April 56,811,123,429 4,082 57,809,246,732 4,153
Allotted during the year 3,883,860 – 1,876,697 –
Cancelled during the year (3,000,000,000) (216) (1,000,000,000) (71)
31 March 53,815,007,289 3,866 56,811,123,429 4,082
Notes:
1 50,000 (2011: 50,000) 7% cumulative xed rate shares of £1 each were allotted, issued and fully paid by the Company.
2 At 31 March 2012 the Company held 4,169,067,107 (2011: 5,233,597,599) treasury shares with a nominal value of £299 million (2011: £376 million).
Allotted during the year
Nominal Net
value proceeds
Number £m £m
Share awards and option scheme awards13,883,860 – 7
Note:
1 Shares allocated during the year were in relation to US share awards and option schemes.
Notes to the Company nancial statements (continued)