Vodafone 2012 Annual Report Download - page 52
Download and view the complete annual report
Please find page 52 of the 2012 Vodafone annual report below. You can navigate through the pages in the report by either clicking on the pages listed below, or by using the keyword search tool below to find specific information within the annual report.-
 1
1 -
2
-
3
-
4
-
5
-
6
-
7
-
8
-
9
-
10
-
11
-
12
-
13
-
14
-
15
-
16
-
17
-
18
-
19
-
20
-
21
-
22
-
23
-
24
-
25
-
26
-
27
-
28
-
29
-
30
-
31
-
32
-
33
-
34
-
35
-
36
-
37
-
38
-
39
-
40
-
41
-
 42
42 -
 43
43 -
 44
44 -
 45
45 -
 46
46 -
 47
47 -
 48
48 -
 49
49 -
 50
50 -
 51
51 -
 52
52 -
 53
53 -
 54
54 -
 55
55 -
 56
56 -
 57
57 -
 58
58 -
 59
59 -
 60
60 -
 61
61 -
 62
62 -
63
-
64
-
65
-
66
-
67
-
68
-
69
-
70
-
71
-
72
-
73
-
74
-
75
-
76
-
77
-
78
-
79
-
80
-
81
-
82
-
83
-
84
-
85
-
86
-
87
-
88
-
89
-
90
-
91
-
92
-
93
-
94
-
95
-
96
-
97
-
98
-
99
-
100
-
101
-
102
-
103
-
104
-
105
-
106
-
107
-
108
-
109
-
110
-
111
-
112
-
113
-
114
-
115
-
116
-
117
-
118
-
119
-
120
-
121
-
122
-
123
-
124
-
125
-
126
-
127
-
128
-
129
-
130
-
131
-
132
-
133
-
134
-
135
-
136
-
137
-
138
-
139
-
140
-
141
-
142
-
143
-
144
-
145
-
146
-
147
-
148
-
149
-
150
-
151
-
152
-
153
-
154
-
155
-
156
-
157
-
158
-
159
-
160
-
161
-
162
-
163
-
164
-
165
-
166
-
167
-
168
-
169
-
170
-
171
-
172
-
173
-
174
-
175
-
176
 |
 |

50
Vodafone Group Plc
Annual Report 2012
Guidance
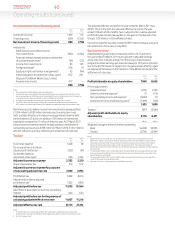
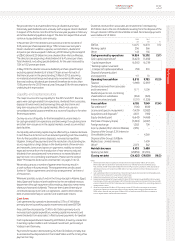
Performance against 2012 nancial year guidance
Based on guidance foreign exchange rates, our adjusted operating
protfor the 2012 nancial year was £11.8 billion, at the top end of the
£11.0billion to £11.8 billion range set in May 2011. On the same basis,
ourfree cash ow was £6.2 billion, in the middle of the £6.0 billion to
£6.5billion range.
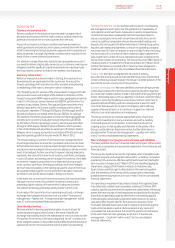
2013 nancial year guidance
Adjusted
operating
prot
£bn
Free
cash ow
£bn
2012 reported performance 11.5 6.1
SFR/Polkomtel contribution and
restructuring cost – (0.2)
Foreign exchange1(0.4) (0.3)
2012 nancial rebased reported 11.1 5.6
2013 nancial year guidance 11.1 – 11.9 5.3 – 5.8
Note:
1 Impact of rebasing the 2012 reported performance using the 2013 nancial year guidance foreign
exchange rates of £1:€1.23 and £1:$US1.62.
Guidance for the 2013 nancial year is based on our current assessment
of the global macroeconomic outlook and assumes foreign exchange
rates of £1:€1.23 and £1: US$1.62. In addition, we will no longer receive
adividend from SFR after the sale of our stake during the 2012 nancial
year. We have restated the 2012 nancial year adjusted operating prot
and free cash ow for both these changes in the table above.
Therefore, on an underlying basis, we expect growth in adjusted
operating prot, and stability in free cash ow, compared with the 2012
nancial year.
Adjusted operating prot is expected to be in the range of £11.1 billion to
£11.9 billion and free cash ow in the range of £5.3 billion to £5.8 billion,
excluding any income dividends received from Verizon Wireless.
We expect the Group EBITDA margin decline to continue its improving
trend, supported by continued strong growth and operating leverage in
our AMAP region, and improving control of commercial costs in Europe.
We expect capital expenditure to remain broadly steady on a constant
currency basis.
In November 2010 we gave annual guidance ranges for organic service
revenue growth and free cash ow which were based on the prevailing
macroeconomic environment, regulatory framework and foreign
exchange rates. Given larger MTR reductions than previously envisaged,
we now expect organic service revenue growth in the 2013 nancial
year to be slightly below our previous medium term guidance range.
Wewill provide an update on revenue prospects for the 2014 nancial
year when we publish our results for the year ending 31 March 2013.
Weexpect the Group EBITDA margin to stabilise by March 2014.
Our medium term free cash ow guidance is £5.5 billion to £6.5 billion
per annum to March 2014. This was based on the prevailing foreign
exchange rates in November 2010, including an exchange rate of
£1: €1.15. Based on the £1: €1.23 foreign exchange rate used for
the2013 nancial guidance, the equivalent range is £5.2 billion
to£6.2billion. This cash generation underpins the three year 7%
perannum dividend per share growth target issued in May 2010.
Wecontinue to expect that total ordinary dividends per share will
benoless than 10.18 pence for the 2013 nancial year.
Assumptions
Guidance for the 2013 nancial year and the medium term is based
onour current assessment of the global macroeconomic outlook and
assumes foreign exchange rates of £1:€1.23 and £1:US$1.62. It excludes
the impact of licence and spectrum purchases, income dividends from
Verizon Wireless, material one-off tax-related payments, restructuring
costs and any fundamental structural change to the eurozone. It also
assumes no material change to the current structure of the Group.
With respect to the 7% per annum dividend per share growth target, as
the Group’s free cash ow is predominantly generated by companies
operating within the eurozone, we have assumed that the euro to
sterling exchange rate remains within 5% of the above guidance foreign
exchange rate.
Actual foreign exchange rates may vary from the foreign exchange rate
assumptions used. A 1% change in the euro to sterling exchange rate
would impact adjusted operating prot by £40 million and free cash
ow by approximately £30 million and a 1% change in the dollar to
sterling exchange rate would impact adjusted operating prot by
approximately £50 million.