Vodafone 2012 Annual Report Download - page 12
Download and view the complete annual report
Please find page 12 of the 2012 Vodafone annual report below. You can navigate through the pages in the report by either clicking on the pages listed below, or by using the keyword search tool below to find specific information within the annual report.-
 1
1 -
 2
2 -
 3
3 -
 4
4 -
 5
5 -
 6
6 -
 7
7 -
 8
8 -
 9
9 -
 10
10 -
 11
11 -
 12
12 -
 13
13 -
 14
14 -
 15
15 -
 16
16 -
 17
17 -
 18
18 -
 19
19 -
 20
20 -
 21
21 -
 22
22 -
23
-
24
-
25
-
26
-
27
-
28
-
29
-
30
-
31
-
32
-
33
-
34
-
35
-
36
-
37
-
38
-
39
-
40
-
41
-
42
-
43
-
44
-
45
-
46
-
47
-
48
-
49
-
50
-
51
-
52
-
53
-
54
-
55
-
56
-
57
-
58
-
59
-
60
-
61
-
62
-
63
-
64
-
65
-
66
-
67
-
68
-
69
-
70
-
71
-
72
-
73
-
74
-
75
-
76
-
77
-
78
-
79
-
80
-
81
-
82
-
83
-
84
-
85
-
86
-
87
-
88
-
89
-
90
-
91
-
92
-
93
-
94
-
95
-
96
-
97
-
98
-
99
-
100
-
101
-
102
-
103
-
104
-
105
-
106
-
107
-
108
-
109
-
110
-
111
-
112
-
113
-
114
-
115
-
116
-
117
-
118
-
119
-
120
-
121
-
122
-
123
-
124
-
125
-
126
-
127
-
128
-
129
-
130
-
131
-
132
-
133
-
134
-
135
-
136
-
137
-
138
-
139
-
140
-
141
-
142
-
143
-
144
-
145
-
146
-
147
-
148
-
149
-
150
-
151
-
152
-
153
-
154
-
155
-
156
-
157
-
158
-
159
-
160
-
161
-
162
-
163
-
164
-
165
-
166
-
167
-
168
-
169
-
170
-
171
-
172
-
173
-
174
-
175
-
176
 |
 |

10
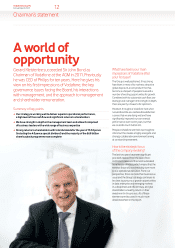
Vodafone Group Plc
Annual Report 2012
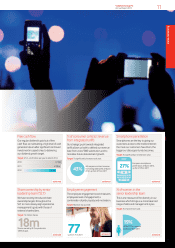
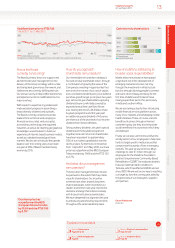
Organic service revenue growth
Growth in the top line demonstrates our
abilityto grow our customer base and
stabiliseor increase ARPU. It also helps
tomaintain margins.
Target: 1 –4% per year to March 2014.
% of European network with
3G(14.4 Mbps or better)
Faster, more reliable networks with
widercoverage stimulate data usage
andcreate aclear point of difference
overother operators.
Target: 99% by March 2015.
EBITDA margin
Trends in our EBITDA margins demonstrate
whether our revenue growth isgenerating a
good return on our investment in customer
acquisition, and whether we can offset
underlying cost pressures in our business
with cost efciencies elsewhere.
Target: EBITDA margin to stabilise by March 2014.
Adjusted operating prot (‘AOP’)
Because of the signicant contribution
madeto our overall protability by our
USassociate, Verizon Wireless, AOP is a
better determinant of overall protability
than EBITDA.
Target: £11.0 – £11.8 billion in 2012 nancial year.
82%
of European 3G network
atleast 14.4 Mbps,
up from 66% in 2011
How we’re doing
We track our performance against 12 key
nancial, operational and commercial
metrics which we judged to be the best
indicators of how we’re doing.
–1.6%2010
2011
2012
2.1%
1.5% 33.1%2010
2011
2012
32.0%
31.2%
£11.5bn2010
2011
2012
£11.8bn
£11.5bn
Returns to shareholders
Consistent and balanced returns to
shareholders demonstrate our commitment
tocapital discipline.
Target: Dividend per share growth of at least 7% per
year to March 2013 (excluding special dividends).
+6.9%2010
2011
2012
+7.1%
+7.0%
on-track
Relative market share
performance
We track our relative performance by
measuring the change in our mobile
marketshare against our competitors.
Target: Gain or hold mobile service revenue
marketshare in most of our main markets against
ourprincipal competitor.
5/7
We gained mobile service
revenue market share in
5 out of 7 of our main markets.
on-track
achievedachieved
achievedachieved