Vodafone 2012 Annual Report Download - page 42
Download and view the complete annual report
Please find page 42 of the 2012 Vodafone annual report below. You can navigate through the pages in the report by either clicking on the pages listed below, or by using the keyword search tool below to find specific information within the annual report.-
 1
1 -
2
-
3
-
4
-
5
-
6
-
7
-
8
-
9
-
10
-
11
-
12
-
13
-
14
-
15
-
16
-
17
-
18
-
19
-
20
-
21
-
22
-
23
-
24
-
25
-
26
-
27
-
28
-
29
-
30
-
31
-
 32
32 -
 33
33 -
 34
34 -
 35
35 -
 36
36 -
 37
37 -
 38
38 -
 39
39 -
 40
40 -
 41
41 -
 42
42 -
 43
43 -
 44
44 -
 45
45 -
 46
46 -
 47
47 -
 48
48 -
 49
49 -
 50
50 -
 51
51 -
 52
52 -
53
-
54
-
55
-
56
-
57
-
58
-
59
-
60
-
61
-
62
-
63
-
64
-
65
-
66
-
67
-
68
-
69
-
70
-
71
-
72
-
73
-
74
-
75
-
76
-
77
-
78
-
79
-
80
-
81
-
82
-
83
-
84
-
85
-
86
-
87
-
88
-
89
-
90
-
91
-
92
-
93
-
94
-
95
-
96
-
97
-
98
-
99
-
100
-
101
-
102
-
103
-
104
-
105
-
106
-
107
-
108
-
109
-
110
-
111
-
112
-
113
-
114
-
115
-
116
-
117
-
118
-
119
-
120
-
121
-
122
-
123
-
124
-
125
-
126
-
127
-
128
-
129
-
130
-
131
-
132
-
133
-
134
-
135
-
136
-
137
-
138
-
139
-
140
-
141
-
142
-
143
-
144
-
145
-
146
-
147
-
148
-
149
-
150
-
151
-
152
-
153
-
154
-
155
-
156
-
157
-
158
-
159
-
160
-
161
-
162
-
163
-
164
-
165
-
166
-
167
-
168
-
169
-
170
-
171
-
172
-
173
-
174
-
175
-
176
 |
 |

40
Vodafone Group Plc
Annual Report 2012
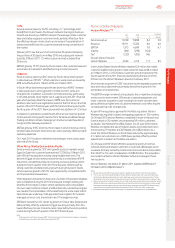
Operating results
This section presents our operating performance, providing commentary on how the revenue and the EBITDA performance of the Group and its
operating segments within Europe, Africa, Middle East and Asia Pacic, and Non-Controlled Interests and Common Functions have developed in
the last three years.
2012 nancial year compared to the 2011 nancial year
Group1
Europe
£m
Africa,
Middle East
and Asia
Pacic
£m
Non-Controlled
Interests and
Common
Functions2
£m
Eliminations
£m
2012
£m
2011
£m
% change
£ Organic
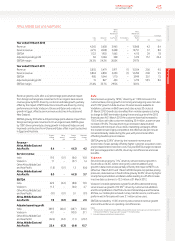
Revenue 32,181 13,868 423 (55) 46,417 45,884 1.2 2.2
Service revenue 29,914 12,751 272 (52) 42,885 42,738 0.3 1.5
EBITDA 10,445 4,115 (85) – 14,475 14,670 (1.3) (0.6)
Adjusted operating prot 5,260 1,472 4,800 – 11,532 11,818 (2.4) 2.5
Adjustments for:
Impairment loss (4,050) (6,150)
Other income/(expense)33,705 (72)
Operating prot 11,187 5,596
Non-operating (expense)/income4(162) 3,022
Net (nancing costs)/investment income (1,476) 880
Prot before taxation 9,549 9,498
Income tax expense (2,546) (1,628)
Prot for the nancial year 7,003 7,870
Notes:
1 Current year results reect average foreign exchange rates of £1:€1.16 and £1:US$1.60.
2 Common Functions primarily represent the results of the partner markets and the net result of unallocated central Group costs.
3 Other income/(expense) for the year ended 31 March 2012 includes a £3,419 million gain on disposal of the Group’s 44% interest in SFR and a £296 million gain on disposal of the Group’s 24.4% interest in Polkomtel.
Theyearended 31 March 2011 included £56 million representing the net loss on disposal of certain Alltel investments by Verizon Wireless. This is included within the line item “Share of results in associates” in the
consolidated income statement.
4 Non-operating (expense)/income for the year ended 31 March 2011 included £3,019 million prot arising on the sale of the Group’s 3.2% interest in China Mobile Limited.
Revenue
Group revenue was up 1.2% to £46.4 billion, with service revenue
of £42.9 billion, an increase of 1.5%* on an organic basis. Our overall
performance reects continued strong demand for data services
and further voice penetration growth in emerging markets, offset by
regulatory changes, ongoing competitive pressures and challenging
macroeconomic conditions in a number of our mature markets. As a
result of the leap year, service revenue growth of 2.3%* in Q4 beneted
from the additional day by around 1 percentage point.
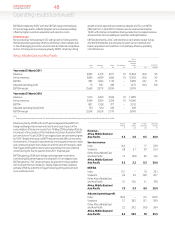
AMAP service revenue was up by 8.0%*, with a strong performance in
India, Qatar, Ghana and Vodacom and a return to growth in Egypt offset
by a decline in Australia.
In Europe, service revenue was down by 1.1%* reecting challenging
macroeconomic conditions in Southern Europe partially offset by
growth in Germany, the UK, the Netherlands and Turkey.
EBITDA and prot
Group EBITDA was down 1.3% to £14.5 billion, as revenue growth was
offset by higher customer investment due to increased smartphone
penetration.
Adjusted operating prot was down 2.4% to £11.5 billion, driven by a
reduction in our share of prots from associates following the disposal
ofour 44% interest in SFR in June 2011. Our share of prots of Verizon
Wireless grew by 9.3%* to £4.9 billion.
Operating prot increased by 100% to £11.2 billion, primarily due to the
gain on disposal of the Group’s 44% interest in SFR and 24.4% interest in
Polkomtel, and lower impairment losses compared to the prior year.
An impairment loss of £4.0 billion was recorded in relation to Italy, Spain,
Portugal and Greece, primarily driven by lower projected cash ows
within business plans and an increase in discount rates, resulting from
adverse changes in the economic environment.
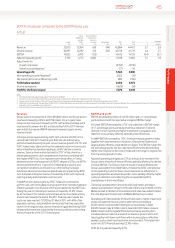
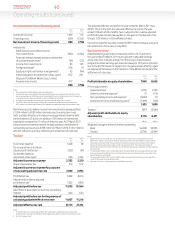
Net (nancing costs)/investment income
2012
£m
2011
£m
Investment income 456 1,309
Financing costs (1,932) (429)
Net (nancing costs)/investment income (1,476) 880
Analysed as:
Net nancing costs before income
from investments (1,642) (852)
Potential interest credit/(charges) arising on
settlement of outstanding tax issues19 (46)
Income from investments 19 83
Foreign exchange2 138 256
Equity put rights and similar arrangements3– 95
Interest related to the settlement of tax cases – 872
Disposal of SoftBank Mobile Corp. Limited
nancial instruments – 472
(1,476) 880
Notes:
1 Excluding interest credits related to a tax case settlement.
2 Comprises foreign exchange rate differences reected in the income statement in relation to certain
intercompany balances and the foreign exchange rate differences on nancial instruments received as
consideration on the disposal of Vodafone Japan to SoftBank in April 2006.
3 The year ended 31 March 2011 included foreign exchange rate movements, accretion expense and fair
value charges.
Net nancing costs before income from investments increased from
£852 million to £1,642 million, primarily due to the decision to increase
the xed rate debt mix, which is expected to result in lower interest in
future periods, and the subsequent recognition of mark-to-market
losses. Income from investments decreased by £64 million as a result of
the disposal of the Group’s 3.2% interest in China Mobile Limited and the
Group’s interests in SoftBank Mobile Corp. Limited during the 2011
nancial year.