Vodafone 2006 Annual Report Download - page 99
Download and view the complete annual report
Please find page 99 of the 2006 Vodafone annual report below. You can navigate through the pages in the report by either clicking on the pages listed below, or by using the keyword search tool below to find specific information within the annual report.-
 1
1 -
2
-
3
-
4
-
5
-
6
-
7
-
8
-
9
-
10
-
11
-
12
-
13
-
14
-
15
-
16
-
17
-
18
-
19
-
20
-
21
-
22
-
23
-
24
-
25
-
26
-
27
-
28
-
29
-
30
-
31
-
32
-
33
-
34
-
35
-
36
-
37
-
38
-
39
-
40
-
41
-
42
-
43
-
44
-
45
-
46
-
47
-
48
-
49
-
50
-
51
-
52
-
53
-
54
-
55
-
56
-
57
-
58
-
59
-
60
-
61
-
62
-
63
-
64
-
65
-
66
-
67
-
68
-
69
-
70
-
71
-
72
-
73
-
74
-
75
-
76
-
77
-
78
-
79
-
80
-
81
-
82
-
83
-
84
-
85
-
86
-
87
-
88
-
 89
89 -
 90
90 -
 91
91 -
 92
92 -
 93
93 -
 94
94 -
 95
95 -
 96
96 -
 97
97 -
 98
98 -
 99
99 -
 100
100 -
 101
101 -
 102
102 -
 103
103 -
 104
104 -
 105
105 -
 106
106 -
 107
107 -
 108
108 -
 109
109 -
110
-
111
-
112
-
113
-
114
-
115
-
116
-
117
-
118
-
119
-
120
-
121
-
122
-
123
-
124
-
125
-
126
-
127
-
128
-
129
-
130
-
131
-
132
-
133
-
134
-
135
-
136
-
137
-
138
-
139
-
140
-
141
-
142
-
143
-
144
-
145
-
146
-
147
-
148
-
149
-
150
-
151
-
152
 |
 |
Vodafone Group Plc Annual Report 2006 97
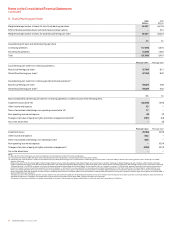
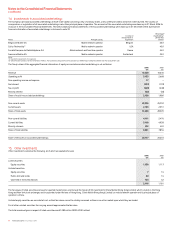
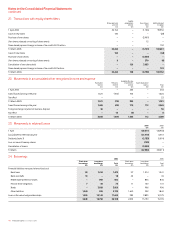
16. Inventory 2006 2005
£m £m
Goods held for resale 297 440
Inventory is reported net of allowances for obsolescence, an analysis of which is as follows:
2006 2005
£m £m
At 1 April 121 189
Transfer in respect of discontinued operations (40) –
Exchange movements 1(4)
Amounts charged/(credited) to the income statement 15 (64)
At 31 March 97 121
Cost of sales includes amounts related to inventory amounting to £3,662 million (2005: £3,205 million).
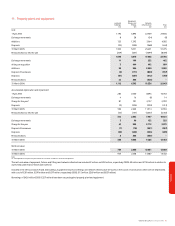
17. Trade and other receivables 2006 2005
£m £m
Included within non-current assets:
Trade receivables 37 42
Other receivables 28 113
Prepayments and accrued income 65 66
Derivative financial instruments 231 364
361 585
Included within current assets:
Trade receivables 2,462 2,802
Amounts owed by associated undertakings 12 22
Other receivables 399 396
Prepayments and accrued income 1,486 1,900
Derivative financial instruments 79 44
4,438 5,164
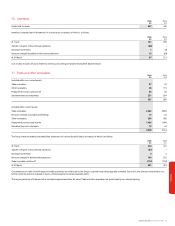
The Group’s trade receivables are stated after allowances for bad and doubtful debts, an analysis of which is as follows:
2006 2005
£m £m
At 1 April 474 441
Transfer in respect of discontinued operations (41) –
Exchange movements 45
Amounts charged to administrative expenses 168 222
Trade receivables written off (174) (194)
At 31 March 431 474
Concentrations of credit risk with respect to trade receivables are limited due to the Group’s customer base being large and unrelated. Due to this, the directors believe there is no
further credit risk provision required in excess of the allowance for bad and doubtful debts.
The carrying amounts of trade and other receivables approximate their fair value. Trade and other receivables are predominantly non-interest bearing.
Financials