Vodafone 2006 Annual Report Download - page 83
Download and view the complete annual report
Please find page 83 of the 2006 Vodafone annual report below. You can navigate through the pages in the report by either clicking on the pages listed below, or by using the keyword search tool below to find specific information within the annual report.-
 1
1 -
2
-
3
-
4
-
5
-
6
-
7
-
8
-
9
-
10
-
11
-
12
-
13
-
14
-
15
-
16
-
17
-
18
-
19
-
20
-
21
-
22
-
23
-
24
-
25
-
26
-
27
-
28
-
29
-
30
-
31
-
32
-
33
-
34
-
35
-
36
-
37
-
38
-
39
-
40
-
41
-
42
-
43
-
44
-
45
-
46
-
47
-
48
-
49
-
50
-
51
-
52
-
53
-
54
-
55
-
56
-
57
-
58
-
59
-
60
-
61
-
62
-
63
-
64
-
65
-
66
-
67
-
68
-
69
-
70
-
71
-
72
-
 73
73 -
 74
74 -
 75
75 -
 76
76 -
 77
77 -
 78
78 -
 79
79 -
 80
80 -
 81
81 -
 82
82 -
 83
83 -
 84
84 -
 85
85 -
 86
86 -
 87
87 -
 88
88 -
 89
89 -
 90
90 -
 91
91 -
 92
92 -
 93
93 -
94
-
95
-
96
-
97
-
98
-
99
-
100
-
101
-
102
-
103
-
104
-
105
-
106
-
107
-
108
-
109
-
110
-
111
-
112
-
113
-
114
-
115
-
116
-
117
-
118
-
119
-
120
-
121
-
122
-
123
-
124
-
125
-
126
-
127
-
128
-
129
-
130
-
131
-
132
-
133
-
134
-
135
-
136
-
137
-
138
-
139
-
140
-
141
-
142
-
143
-
144
-
145
-
146
-
147
-
148
-
149
-
150
-
151
-
152
 |
 |

Vodafone Group Plc Annual Report 2006 81
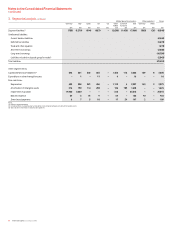
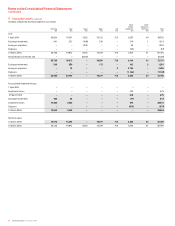
Continuing Discontinued
Mobile telecommunications Other operations operations operations Group
Germany Italy Spain UK US Other Common Total Germany Other
mobile functions
£m £m £m £m £m £m £m £m £m £m £m £m £m
31 March 2005
Service revenue 5,320 4,091 2,963 4,498 – 6,973 23,845 1,095 – 24,940 5,610
Equipment and other revenue 364 182 298 567 – 664 2,075 – – 2,075 1,786
Segment revenue 5,684 4,273 3,261 5,065 – 7,637 25,920 1,095 – 27,015 7,396
Subsidiaries 5,684 – 3,261 5,065 – 6,474 20,484 1,095 – 21,579 7,396
Joint ventures – 4,273–––1,184 5,457 – – 5,457 –
Less: intra-segment revenue –––––(21) (21) – – (21) –
Common functions 123 123 123
Inter-segment revenue (51) (36) (80) (47) – (84) (5) (303) – – (303) (1)
Net revenue 5,633 4,237 3,181 5,018 – 7,553 118 25,740 1,095 – 26,835 7,395
Less: revenue between mobile and
other operations (110) –––––(1)(111) (46) – (157) –
Group revenue 5,523 4,237 3,181 5,018 – 7,553 117 25,629 1,049 – 26,678 7,395
Segment result 1,473 1,694 775 779 – 1,198 5,919 64 – 5,983 664
Subsidiaries 1,473 – 775 779 – 893 3,920 64 – 3,984 664
Joint ventures – 1,694–––305 1,999––1,999
Common functions (85) (85) (85)
Share of result in associated undertakings ––––1,354671 2,025–(45) 1,980 –
Operating profit/(loss) 1,473 1,694 775 779 1,354 1,869 (85) 7,859 64 (45) 7,878 664
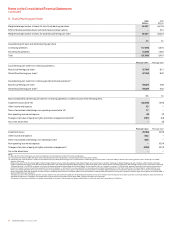
Non-operating income and expense (7) 13
Investment income 294 9
Financing costs (880) (20)
Profit before taxation 7,285 666
Tax on profit (1,869) 436
Profit for the financial year 5,416 1,102 6,518
Operating profit/(loss) 1,473 1,694 775 779 1,354 1,869 (85) 7,859 64 (45) 7,878 664
Add back:
Impairment losses –––––475–475––475 –
Adjusted operating profit/(loss) 1,473 1,694 775 779 1,354 2,344 (85) 8,334 64 (45) 8,353 664
Non-current assets(1) 44,101 22,768 12,288 9,014 – 12,443 884 101,498 752 – 102,250 13,754 116,004
Investment in associated undertakings ––––15,039 5,096 33 20,168 – 66 20,234 – 20,234
Current assets(1) 811 844 356 741 – 1,301 118 4,171 221 – 4,392 1,168 5,560
Total segment assets(1) 44,912 23,612 12,644 9,755 15,039 18,840 1,035 125,837 973 66 126,876 14,922 141,798
Unallocated non-current assets:
Deferred tax assets 1,184
Trade and other receivables 364
Unallocated current assets:
Cash and cash equivalents 3,769
Trade and other receivables 44
Taxation recoverable 38
Total assets 147,197
Financials