Vodafone 2006 Annual Report Download - page 84
Download and view the complete annual report
Please find page 84 of the 2006 Vodafone annual report below. You can navigate through the pages in the report by either clicking on the pages listed below, or by using the keyword search tool below to find specific information within the annual report.-
 1
1 -
2
-
3
-
4
-
5
-
6
-
7
-
8
-
9
-
10
-
11
-
12
-
13
-
14
-
15
-
16
-
17
-
18
-
19
-
20
-
21
-
22
-
23
-
24
-
25
-
26
-
27
-
28
-
29
-
30
-
31
-
32
-
33
-
34
-
35
-
36
-
37
-
38
-
39
-
40
-
41
-
42
-
43
-
44
-
45
-
46
-
47
-
48
-
49
-
50
-
51
-
52
-
53
-
54
-
55
-
56
-
57
-
58
-
59
-
60
-
61
-
62
-
63
-
64
-
65
-
66
-
67
-
68
-
69
-
70
-
71
-
72
-
73
-
 74
74 -
 75
75 -
 76
76 -
 77
77 -
 78
78 -
 79
79 -
 80
80 -
 81
81 -
 82
82 -
 83
83 -
 84
84 -
 85
85 -
 86
86 -
 87
87 -
 88
88 -
 89
89 -
 90
90 -
 91
91 -
 92
92 -
 93
93 -
 94
94 -
95
-
96
-
97
-
98
-
99
-
100
-
101
-
102
-
103
-
104
-
105
-
106
-
107
-
108
-
109
-
110
-
111
-
112
-
113
-
114
-
115
-
116
-
117
-
118
-
119
-
120
-
121
-
122
-
123
-
124
-
125
-
126
-
127
-
128
-
129
-
130
-
131
-
132
-
133
-
134
-
135
-
136
-
137
-
138
-
139
-
140
-
141
-
142
-
143
-
144
-
145
-
146
-
147
-
148
-
149
-
150
-
151
-
152
 |
 |

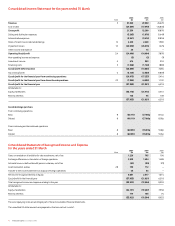
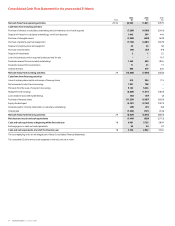
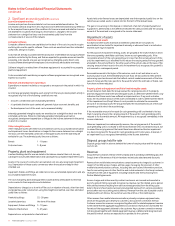
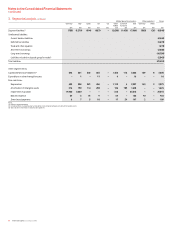
82 Vodafone Group Plc Annual Report 2006
Notes to the Consolidated Financial Statements
continued
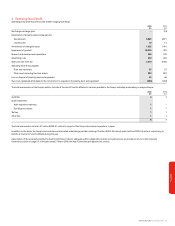
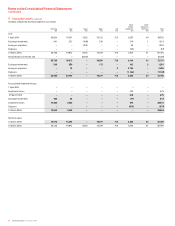
3. Segmental analysis continued Continuing Discontinued
Mobile telecommunications Other operations operations operations Group
Germany Italy Spain UK US Other Common Total Germany Other
mobile functions
£m £m £m £m £m £m £m £m £m £m £m £m £m
Segment liabilities(1) (848) (1,237) (735) (939) – (2,295) (1,180) (7,234) (364) – (7,598) (1,477) (9,075)
Unallocated liabilities:
Current taxation liabilities (4,353)
Deferred tax liabilities (4,849)
Short-term borrowings (2,003)
Long-term borrowings (13,190)
Trade and other payables (79)
Total liabilities (33,549)
Other segment items:
Capitalised fixed asset additions(2) 827 538 490 789 – 1,333 136 4,113 112 – 4,225 885
Expenditure on other intangible assets – 8 – – – 118 – 126 – – 126 –
Non-cash items:
Depreciation 640 403 253 464 – 961 11 2,732 153 – 2,885 1,114
Amortisation of intangible assets 514 184 101 468 – 142 7 1,416 – – 1,416 100
Impairment of goodwill – – – – – 475 – 475 – – 475 –
Bad debt expense 50 13 35 36 – 39 – 173 10 – 183 39
Share-based payments 3 4 2 15 – 11 94 129 1 – 130 7
Notes:
(1) Excluding unallocated items.
(2) Includes additions to property, plant and equipment and computer software, included with intangible assets.