Vodafone 2006 Annual Report Download - page 35
Download and view the complete annual report
Please find page 35 of the 2006 Vodafone annual report below. You can navigate through the pages in the report by either clicking on the pages listed below, or by using the keyword search tool below to find specific information within the annual report.-
 1
1 -
2
-
3
-
4
-
5
-
6
-
7
-
8
-
9
-
10
-
11
-
12
-
13
-
14
-
15
-
16
-
17
-
18
-
19
-
20
-
21
-
22
-
23
-
24
-
 25
25 -
 26
26 -
 27
27 -
 28
28 -
 29
29 -
 30
30 -
 31
31 -
 32
32 -
 33
33 -
 34
34 -
 35
35 -
 36
36 -
 37
37 -
 38
38 -
 39
39 -
 40
40 -
 41
41 -
 42
42 -
 43
43 -
 44
44 -
 45
45 -
46
-
47
-
48
-
49
-
50
-
51
-
52
-
53
-
54
-
55
-
56
-
57
-
58
-
59
-
60
-
61
-
62
-
63
-
64
-
65
-
66
-
67
-
68
-
69
-
70
-
71
-
72
-
73
-
74
-
75
-
76
-
77
-
78
-
79
-
80
-
81
-
82
-
83
-
84
-
85
-
86
-
87
-
88
-
89
-
90
-
91
-
92
-
93
-
94
-
95
-
96
-
97
-
98
-
99
-
100
-
101
-
102
-
103
-
104
-
105
-
106
-
107
-
108
-
109
-
110
-
111
-
112
-
113
-
114
-
115
-
116
-
117
-
118
-
119
-
120
-
121
-
122
-
123
-
124
-
125
-
126
-
127
-
128
-
129
-
130
-
131
-
132
-
133
-
134
-
135
-
136
-
137
-
138
-
139
-
140
-
141
-
142
-
143
-
144
-
145
-
146
-
147
-
148
-
149
-
150
-
151
-
152
 |
 |

Vodafone Group Plc Annual Report 2006 33
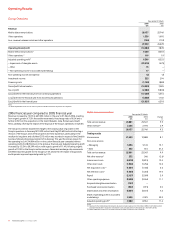
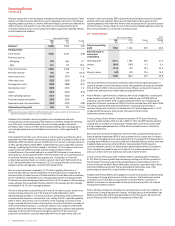
additions, led to a 5.2% increase in net acquisition costs. Interconnect costs decreased by
0.3%, as the termination rate cuts in the current and previous financial years more than
offset the effect of higher voice usage. An increase in the number of customer upgrades
resulted in a 5.6% increase in net retention costs. Adjusted operating profit was further
impacted by additional depreciation charges from continued 3G network deployment.
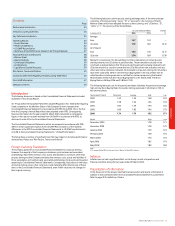
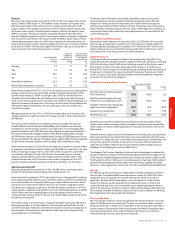
Italy Local
Years ended 31 March currency
2006 2005 Change change
£m £m % %
Revenue(1) 4,363 4,273 2.1 2.0
Trading results
Voice services 3,472 3,492 (0.6) (0.7)
Non-voice services
– Messaging 600 532 12.8 12.9
– Data 98 67 46.3 45.2
Total service revenue 4,170 4,091 1.9 1.8
Net other revenue(1) 15 14 7.1 2.8
Interconnect costs (681) (701) (2.9) (3.1)
Other direct costs (241) (232) 3.9 3.8
Net acquisition costs(1) (78) (71) 9.9 9.6
Net retention costs(1) (93) (74) 25.7 25.1
Payroll (250) (250) – –
Other operating
expenses (572) (497) 15.1 15.1
Purchased licence
amortisation (74) (74) – –
Depreciation and other
amortisation(3) (524) (512) 2.3 2.0
Adjusted operating
profit(3) 1,672 1,694 (1.3) (1.3)
Notes:
(1) Revenue includes revenue of £178 million (2005: £168 million) which has been excluded from other revenue and
deducted from acquisition and retention costs in the trading results.
(2) Italy is a joint venture and is proportionately consolidated by the Group and hence the results reported represent the
Group’s average effective interest, being 76.8%.
(3) Before impairment losses
Competition in Italy has continued to intensify with the mobile network operators
competing aggressively on subsidies and, increasingly, on price, particularly in the
second half of the year. Vodafone achieved average customer growth of 6.9% driven by
successful promotions despite the competitive environment and a market penetration
rate well in excess of 100% due to customers having more than one SIM.
In local currency, total revenue rose by 2.0%, reflecting the increase in service revenue
which was driven primarily by continuing growth in non-voice services as voice revenue
declined marginally following an average 20.5% reduction in termination rates from
September 2005. Excluding the impact of the termination rate cut, service revenue
increased by 5.2% in local currency. Strong promotional activities, for example free calls
after the first minute and free text messages for a small activation fee which were taken
up by more than ten million customers, and the increase in the customer base led to a
rise of 5.1% in voice usage and a 41.7% increase in messaging, including a 261% growth
in MMS usage. An increase in the number of SIMs per user and competitive pressures led
to a reduction in activity rates, especially in the second half of the year, and an increase
in blended churn from 17.2% to 18.7%.
Non-voice service revenue rose by 16.5% in local currency, primarily driven by a 12.9%
rise in messaging revenue. Increased penetration of 3G devices, a focus on retaining
high value customers, increased usage of Vodafone live! and Vodafone Mobile Connect
data cards and attractive data promotions were the main contributors to 45.2% growth
in non-messaging data revenue.
In local currency, adjusted operating profit fell by 1.3% due to the impact of an increase
in Group charges for the use of brand and related trademarks, which represented
approximately 1.1% of service revenue, investment in customer acquisition and
retention and higher marketing spend in response to the competitive pressures, along
with the increased costs from the continued roll out of the 3G network. Strong upgrade
activities and a focus on high value customers in response to aggressive competition led
to the rise in retention costs, whilst handset promotions adversely impacted acquisition
costs, especially in the first half of the year. Interconnect costs fell due to the cut in
termination rates combined with promotions focusing on calls to other Vodafone and
fixed-line numbers, which incur lower interconnect costs, especially in the second half of
the year. Other direct costs increased 3.8%, primarily as a result of an increase in content
provision costs arising from the increase in data service usage.
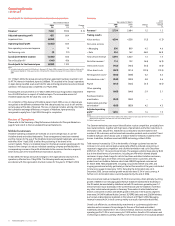
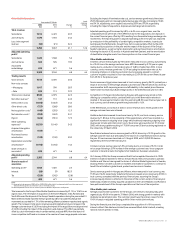
Spain Local
Years ended 31 March currency
2006 2005 Change change
£m £m % %
Revenue(1) 3,995 3,261 22.5 22.6
Trading results
Voice services 3,093 2,558 20.9 20.9
Non-voice services
– Messaging 417 340 22.6 23.0
– Data 105 65 61.5 62.1
Total service revenue 3,615 2,963 22.0 22.0
Net other revenue(1) 62
Interconnect costs (634) (540) 17.4 17.5
Other direct costs (329) (263) 25.1 25.4
Net acquisition costs(1) (274) (246) 11.4 11.7
Net retention costs(1) (249) (172) 44.8 45.3
Payroll (151) (140) 7.9 7.8
Other operating
expenses (611) (468) 30.6 30.7
Purchased licence
amortisation (69) (69) – –
Depreciation and other
amortisation (336) (292) 15.1 14.8
Adjusted operating
profit 968 775 24.9 24.6
Note:
(1) Revenue includes revenue of £374 million (2005: £296 million) which has been excluded from other revenue and
deducted from acquisition and retention costs in the trading results.
Vodafone continued to perform strongly in Spain, in revenue growth and profitability,
despite an increasingly competitive market, through promotions and competitive tariffs
attracting new customers and encouraging prepaid customers to migrate to contract
tariffs.
Total revenue for the financial year increased by 22.6% in local currency, due principally
to a rise in service revenue achieved from an 18.5% growth in the average customer
base and an improvement in ARPU, notwithstanding a 10.6% cut in the termination rate
in November 2005. The launch of attractive tariffs, successful promotional campaigns
and the offer of an appealing handset portfolio increased the average customer base
and encouraged a further increase in the proportion of contract customers from 46.9%
at 31 March 2005 to 49.6% at 31 March 2006. These factors contributed to a 34.0%
increase in total voice usage compared with the previous financial year and a reduction
in blended churn from 21.9% at 31 March 2005 to 20.9% at 31 March 2006.
The principal driver behind the 23.0% growth in messaging revenue in local currency
was a 23.1% increase in messaging usage due to the higher customer base and targeted
promotions. The growth of 62.1% in non-messaging data revenue was due to an
increase of 814,000 in the number of registered 3G devices and the success of data
solutions, which have contributed to Vodafone leading the 3G market in Spain, along
with an 84.3% increase in the number of Vodafone live! devices.
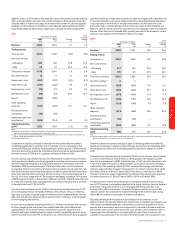
Adjusted operating profit increased as a percentage of service revenue, as cost
reductions were only partially offset by the impact of the increased Group charge for use
of the brand and related trademarks. Interconnect costs fell as a proportion of service
revenue, due to promotions which encouraged calls to be made to Vodafone and fixed-
line numbers, which incur lower interconnect costs, and the cut in termination rates. A
higher proportion of prepaid gross customer additions, which have a lower per unit
acquisition cost, particularly in the first half of the financial year led to acquisition costs
Performance