Vodafone 2006 Annual Report Download - page 111
Download and view the complete annual report
Please find page 111 of the 2006 Vodafone annual report below. You can navigate through the pages in the report by either clicking on the pages listed below, or by using the keyword search tool below to find specific information within the annual report.-
 1
1 -
2
-
3
-
4
-
5
-
6
-
7
-
8
-
9
-
10
-
11
-
12
-
13
-
14
-
15
-
16
-
17
-
18
-
19
-
20
-
21
-
22
-
23
-
24
-
25
-
26
-
27
-
28
-
29
-
30
-
31
-
32
-
33
-
34
-
35
-
36
-
37
-
38
-
39
-
40
-
41
-
42
-
43
-
44
-
45
-
46
-
47
-
48
-
49
-
50
-
51
-
52
-
53
-
54
-
55
-
56
-
57
-
58
-
59
-
60
-
61
-
62
-
63
-
64
-
65
-
66
-
67
-
68
-
69
-
70
-
71
-
72
-
73
-
74
-
75
-
76
-
77
-
78
-
79
-
80
-
81
-
82
-
83
-
84
-
85
-
86
-
87
-
88
-
89
-
90
-
91
-
92
-
93
-
94
-
95
-
96
-
97
-
98
-
99
-
100
-
 101
101 -
 102
102 -
 103
103 -
 104
104 -
 105
105 -
 106
106 -
 107
107 -
 108
108 -
 109
109 -
 110
110 -
 111
111 -
 112
112 -
 113
113 -
 114
114 -
 115
115 -
 116
116 -
 117
117 -
 118
118 -
 119
119 -
 120
120 -
 121
121 -
122
-
123
-
124
-
125
-
126
-
127
-
128
-
129
-
130
-
131
-
132
-
133
-
134
-
135
-
136
-
137
-
138
-
139
-
140
-
141
-
142
-
143
-
144
-
145
-
146
-
147
-
148
-
149
-
150
-
151
-
152
 |
 |

Vodafone Group Plc Annual Report 2006 109
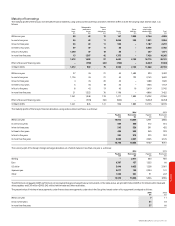
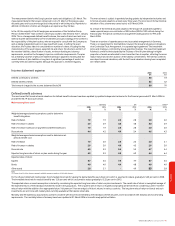
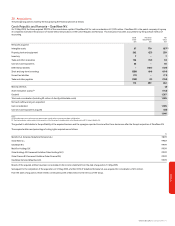
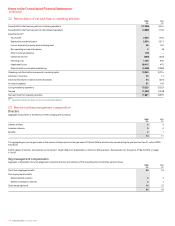
Actual return on scheme assets Germany UK Other Total
2006 2005 2006 2005 2006 2005 2006 2005
£m £m £m £m £m £m £m £m
Actual return on scheme assets 19 7143 54 16 5178 66
Analysis of scheme assets at
31 March is as follows: %%%%%%
Equities 34.1 29.8 79.9 66.6 85.0 81.0
Bonds 59.1 63.6 20.1 16.7 10.0 9.7
Property ––––5.0 4.7
Other 6.8 6.6 –16.7 –4.6
100.0 100.0 100.0 100.0 100.0 100.0
The scheme has no investments in the Group’s equity securities or in property currently used by the Group.
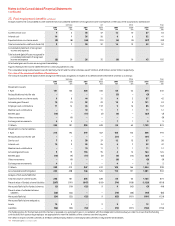
History of experience adjustments Germany UK Other Total
2006 2005 2006 2005 2006 2005 2006 2005
£m £m £m £m £m £m £m £m
Experience adjustments on
scheme liabilities:
Amount (£m) (3) (3) (1) (56) –(1) (4) (60)
Percentage of scheme liabilities (%) 1% 1% –9% –1% –6%
Experience adjustments on scheme assets:
Amount (£m) 10 (1) 99 23 12 2121 24
Percentage of scheme assets (%) 5% 1% 12% 4% 14% 3% 11% 3%
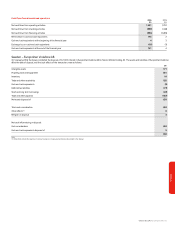
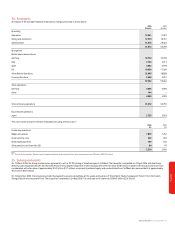
Expected contributions and benefit payments Germany UK Other Total
£m £m £m £m
Expected employer’s contributions in the year ending 31 March 2007 16 36 9 61
Expected benefit payments in the year ending 31 March:
2007 16 11 7 34
2008 15 11 7 33
2009 15 11 7 33
2010 15 12 7 34
2011 15 12 7 34
2012-2017 76 66 38 180
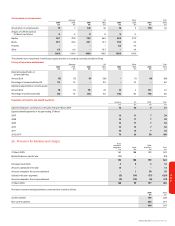
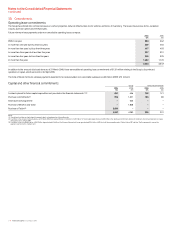
26. Provisions for liabilities and charges Asset
retirement Other
obligations Legal provisions Total
£m £m £m £m
31 March 2005 160 188 199 547
Reclassification as held for sale (25) – – (25)
135 188 199 522
Exchange movements 43310
Amounts capitalised in the year 14––14
Amounts charged to the income statement – 1 38 39
Utilised in the year - payments (3) (74) (77) (154)
Amounts released to the income statement (2) (19) (6) (27)
31 March 2006 148 99 157 404
Provisions have been analysed between current and non-current as follows:
2006 2005
£m £m
Current liabilities 139 228
Non-current liabilities 265 319
404 547
Financials