Vodafone 2006 Annual Report Download - page 95
Download and view the complete annual report
Please find page 95 of the 2006 Vodafone annual report below. You can navigate through the pages in the report by either clicking on the pages listed below, or by using the keyword search tool below to find specific information within the annual report.-
 1
1 -
2
-
3
-
4
-
5
-
6
-
7
-
8
-
9
-
10
-
11
-
12
-
13
-
14
-
15
-
16
-
17
-
18
-
19
-
20
-
21
-
22
-
23
-
24
-
25
-
26
-
27
-
28
-
29
-
30
-
31
-
32
-
33
-
34
-
35
-
36
-
37
-
38
-
39
-
40
-
41
-
42
-
43
-
44
-
45
-
46
-
47
-
48
-
49
-
50
-
51
-
52
-
53
-
54
-
55
-
56
-
57
-
58
-
59
-
60
-
61
-
62
-
63
-
64
-
65
-
66
-
67
-
68
-
69
-
70
-
71
-
72
-
73
-
74
-
75
-
76
-
77
-
78
-
79
-
80
-
81
-
82
-
83
-
84
-
 85
85 -
 86
86 -
 87
87 -
 88
88 -
 89
89 -
 90
90 -
 91
91 -
 92
92 -
 93
93 -
 94
94 -
 95
95 -
 96
96 -
 97
97 -
 98
98 -
 99
99 -
 100
100 -
 101
101 -
 102
102 -
 103
103 -
 104
104 -
 105
105 -
106
-
107
-
108
-
109
-
110
-
111
-
112
-
113
-
114
-
115
-
116
-
117
-
118
-
119
-
120
-
121
-
122
-
123
-
124
-
125
-
126
-
127
-
128
-
129
-
130
-
131
-
132
-
133
-
134
-
135
-
136
-
137
-
138
-
139
-
140
-
141
-
142
-
143
-
144
-
145
-
146
-
147
-
148
-
149
-
150
-
151
-
152
 |
 |
Vodafone Group Plc Annual Report 2006 93
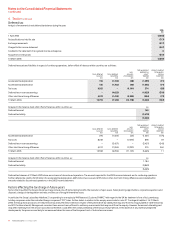
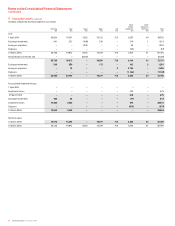
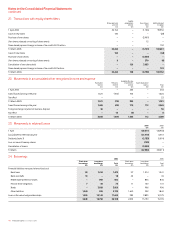
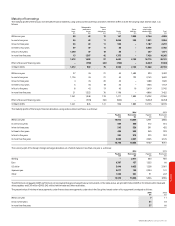
11. Property, plant and equipment Equipment,
Land and fixtures and Network
buildings fittings infrastructure Total
£m £m £m £m
Cost:
1 April 2004 1,193 3,893 22,759 27,845
Exchange movements 8 38 (54) (8)
Additions 125 1,393 3,064 4,582
Disposals (23) (253) (368) (644)
31 March 2005 1,303 5,071 25,401 31,775
Reclassification as held for sale (209) (201) (7,599) (8,009)
1,094 4,870 17,802 23,766
Exchange movements 11 199 252 462
Arising on acquisition 3 404 492 899
Additions 55 984 2,350 3,389
Disposal of businesses (6) (111) (820) (937)
Disposals (67) (257) (412) (736)
Reclassifications 22 306 (328) –
31 March 2006 1,112 6,395 19,336 26,843
Accumulated depreciation and impairment:
1 April 2004 280 2,060 8,393 10,733
Exchange movements 4 16 (6) 14
Charge for the year(1) 81 791 3,127 3,999
Disposals (9) (204) (200) (413)
31 March 2005 356 2,663 11,314 14,333
Reclassification as held for sale (44) (101) (3,347) (3,492)
312 2,562 7,967 10,841
Exchange movements 3 90 132 225
Charge for the year 62 905 2,112 3,079
Disposal of businesses (1) (75) (281) (357)
Disposals (26) (243) (336) (605)
Reclassifications 3 306 (309) –
31 March 2006 353 3,545 9,285 13,183
Net book value:
31 March 2006 759 2,850 10,051 13,660
31 March 2005 947 2,408 14,087 17,442
Note:
(1) The depreciation charge for the year includes £1,114 million in relation to discontinued operations.
The net book value of equipment, fixtures and fittings and network infrastructure includes £2 million and £50 million, respectively (2005: £3 million and £118 million) in relation to
assets held under finance leases (see note 24).
Included in the net book value of land and buildings, equipment, fixtures and fittings and network infrastructure are assets in the course of construction, which are not depreciated,
with a cost of £30 million, £290 million and £677 million, respectively (2005: £15 million, £360 million and £837 million).
Borrowings of £426 million (2005: £327 million) have been secured against property, plant and equipment.
Financials