Vodafone 2006 Annual Report Download - page 31
Download and view the complete annual report
Please find page 31 of the 2006 Vodafone annual report below. You can navigate through the pages in the report by either clicking on the pages listed below, or by using the keyword search tool below to find specific information within the annual report.-
 1
1 -
2
-
3
-
4
-
5
-
6
-
7
-
8
-
9
-
10
-
11
-
12
-
13
-
14
-
15
-
16
-
17
-
18
-
19
-
20
-
 21
21 -
 22
22 -
 23
23 -
 24
24 -
 25
25 -
 26
26 -
 27
27 -
 28
28 -
 29
29 -
 30
30 -
 31
31 -
 32
32 -
 33
33 -
 34
34 -
 35
35 -
 36
36 -
 37
37 -
 38
38 -
 39
39 -
 40
40 -
 41
41 -
42
-
43
-
44
-
45
-
46
-
47
-
48
-
49
-
50
-
51
-
52
-
53
-
54
-
55
-
56
-
57
-
58
-
59
-
60
-
61
-
62
-
63
-
64
-
65
-
66
-
67
-
68
-
69
-
70
-
71
-
72
-
73
-
74
-
75
-
76
-
77
-
78
-
79
-
80
-
81
-
82
-
83
-
84
-
85
-
86
-
87
-
88
-
89
-
90
-
91
-
92
-
93
-
94
-
95
-
96
-
97
-
98
-
99
-
100
-
101
-
102
-
103
-
104
-
105
-
106
-
107
-
108
-
109
-
110
-
111
-
112
-
113
-
114
-
115
-
116
-
117
-
118
-
119
-
120
-
121
-
122
-
123
-
124
-
125
-
126
-
127
-
128
-
129
-
130
-
131
-
132
-
133
-
134
-
135
-
136
-
137
-
138
-
139
-
140
-
141
-
142
-
143
-
144
-
145
-
146
-
147
-
148
-
149
-
150
-
151
-
152
 |
 |

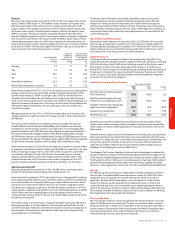
Vodafone Group Plc Annual Report 2006 29
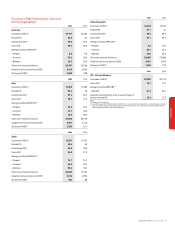
Key Peformance Indicators
The Board and the Executive Committee monitor the Group’s progress against its
strategic objectives and the financial performance of the Group’s operations on a regular
basis. Performance is assessed against the strategy, budgets and forecasts using
financial and non-financial measures.
The following details certain of the most significant Key Performance Indicators (KPIs)
used by the Group, their purpose, the basis of calculation and the source of the
underlying data. Definitions of certain of the terms are provided on page 49.
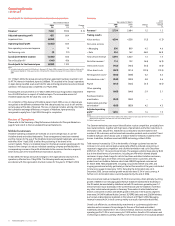
Financial
The Group uses the following primary measures to assess the performance of the Group
and its individual businesses. A number of these measures at a Group level are
presented on an organic basis, which provides an assessment of underlying growth
excluding the effect of business acquisitions and disposals and changes in exchange
rates. Financial measures presented on an organic basis are non-GAAP financial
measures. For more information on these measures and the basis of calculation of
organic growth see “Non-GAAP Information” on pages 47 to 48.
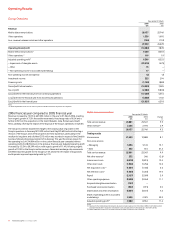
Revenue
Revenue and its growth for the Group, and its principal markets, covering the 2006 and
2005 financial year, is provided in “Operating Results” on pages 30 to 37.
Revenue and revenue growth are used for internal performance analysis and by
investors to assess progress against outlook statements provided externally by the
Group.
Adjusted operating profit
Adjusted operating profit is used by the Group for internal performance analysis as it
represents the underlying operating profitability of the Group’s businesses. The measure
is presented both for the Group and its principal markets, covering the 2006 and 2005
financial years, in “Operating Results” on pages 30 to 37. The basis of calculation, along
with an analysis of why the Group believes it is a useful measure, is provided in the
section titled “Non-GAAP Information” on pages 47 to 48.
Free cash flow
Free cash flow provides an evaluation of the Group’s liquidity and the cash generated by
the Group’s operations. The calculation of free cash flow, along with an analysis of why
the Group believes it is a useful measure, is provided in the section titled “Non-GAAP
Information” on pages 47 to 48. The Group has provided an outlook for free cash flow in
the 2007 financial year on page 45.
Adjusted earnings per share
Adjusted earnings per share is calculated as basic earnings per share from continuing
operations excluding items such as impairment losses, non-recurring amounts related to
business acquisitions and disposals and changes in the fair value of equity put rights and
similar arrangements. The items excluded from basic earnings per share for the 2006
and 2005 financial years and the per share impact are detailed in note 8 to the
Consolidated Financial Statements.
Operational
Certain operational measures relating to customers and revenue for the Group’s mobile
telecommunications business and its principal makets, covering the 2006 and 2005
financial years, are provided in “Operating Results” on pages 30 to 37, with the exception
of customer delight. These measures are commonly used in the mobile
telecommunications industry.
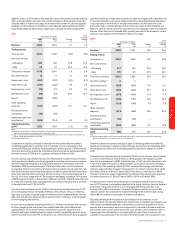
Customers
The Group highly values its customers and strives to delight them. As a result, customer
based KPIs are important measures for internal performance analysis. Management also
believes that certain of these measures provide useful information for investors
regarding the success of the Group’s customer acquisition and retention activities. For
customer numbers and churn, the data used to calculate the KPIs is derived from the
customer relationship management systems of each of the Group’s operations.
Customer numbers
The Group prepares customer numbers on a venture and proportionate basis for its
mobile operations. A summary of the customer numbers on both bases is presented in
“Business – Business Overview – Summary of Group mobile telecommunications
businesses at 31 March 2006” on page 13.
Churn
Churn represents the disconnection rate of customers in each of the Group’s mobile
operations. It is calculated as the total gross customer disconnections in the period
divided by the average total customers in the period. Churn rates stated in this Annual
Report are calculated for the entire financial year.
Customer delight
The Group uses a proprietary ‘customer delight’ system to track customer satisfaction
across its controlled markets and jointly controlled market in Italy. More information on
the benefits of the system are provided in “Business – Business Overview – Products and
services – Customer strategy and management” on page 17.
Customer delight is measured by an index based on the results of surveys performed by
an external research company which cover all aspects of service provided by Vodafone
and incorporates the results of the relative satisfaction of the customers of competitors.
An overall index for the Group is calculated by weighting the results for each of the
Group’s operations based on service revenue.
Increased customer expectations are putting a downward pressure on customer
satisfaction for the Group and many of its competitors. Despite this trend, the Group
outperformed its target for customer delight in the 2006 financial year and the index
was broadly stable compared to the previous financial year.
Revenue based measures
Management believes that revenue based measures provide useful information for
investors regarding trends in customer revenue derived from mobile
telecommunications services and the extent to which customers use mobile services.
The data used to calculate these KPIs is derived from a number of sources. Financial
information, such as service revenue, is extracted from the Group’s financial systems,
whilst operational information, including customer and usage metrics, is derived from
the customer relationship management and billing systems of each of the Group’s
operations.
Average revenue per user (“ARPU”)
ARPU represents the average revenue by customers over a period and is calculated as
service revenue, being total revenue excluding equipment revenue and connection fees,
divided by the weighted average number of customers during the period. ARPU
disclosed in this Annual Report is presented on a monthly basis and represents the total
ARPU for the financial year divided by twelve.
Voice usage
Voice usage is the total number of minutes of voice use on the Group’s mobile networks,
including calls made by the Group’s customers, often referred to as outgoing usage, and
calls received by the Group’s customers, often referred to as incoming usage.
Messaging and data revenue
Messaging and data revenue represent the non-voice element of service revenue. In
recent years, these revenues have grown at a faster rate than voice revenue as
customers increasingly use these services and new products and services have been
launched. As competition has intensified in many of the markets in which the Group
operates and penetration rates have increased, the ability of the Group to grow
messaging and data revenue has become an increasingly important factor, internally
and for investors.
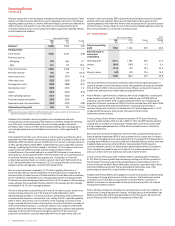
Costs
One Vodafone
The One Vodafone initiatives are targeted at achieving savings in operating expenses
and capital expenditure and are discussed in more detail on pages 18 to 19. Reporting
on performance against these targets will be disclosed in the Annual Report for the year
ending 31 March 2008, including reconciliations to amounts included in the
Consolidated Financial Statements.
Capitalised fixed asset additions as a percentage of mobile revenue
In the mobile telecommunications industry, significant investment is required to roll out
network infrastructure in order to improve service capacity. This performance indicator is
used by Vodafone management to compare capitalised fixed asset additions to prior
periods and internal forecasts. Management believes that this measure provides useful
information for investors to measure the capital investment required to support revenue
growth.
This measure is calculated as capitalised fixed asset additions for the mobile
telecommunications business (note 3 to the Consolidated Financial Statements) as a
percentage of the revenue of the mobile telecommunications businesses (note 3 to the
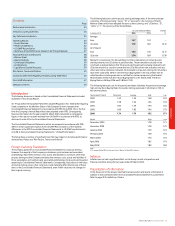
Consolidated Financial Statements). In the 2006 financial year, capitalised fixed asset
additions as a percentage of mobile revenue was 13.7% compared with 16.4% for the
previous financial year.
Performance