Vodafone 2006 Annual Report Download - page 5
Download and view the complete annual report
Please find page 5 of the 2006 Vodafone annual report below. You can navigate through the pages in the report by either clicking on the pages listed below, or by using the keyword search tool below to find specific information within the annual report.-
 1
1 -
 2
2 -
 3
3 -
 4
4 -
 5
5 -
 6
6 -
 7
7 -
 8
8 -
 9
9 -
 10
10 -
 11
11 -
 12
12 -
 13
13 -
 14
14 -
 15
15 -
 16
16 -
17
-
18
-
19
-
20
-
21
-
22
-
23
-
24
-
25
-
26
-
27
-
28
-
29
-
30
-
31
-
32
-
33
-
34
-
35
-
36
-
37
-
38
-
39
-
40
-
41
-
42
-
43
-
44
-
45
-
46
-
47
-
48
-
49
-
50
-
51
-
52
-
53
-
54
-
55
-
56
-
57
-
58
-
59
-
60
-
61
-
62
-
63
-
64
-
65
-
66
-
67
-
68
-
69
-
70
-
71
-
72
-
73
-
74
-
75
-
76
-
77
-
78
-
79
-
80
-
81
-
82
-
83
-
84
-
85
-
86
-
87
-
88
-
89
-
90
-
91
-
92
-
93
-
94
-
95
-
96
-
97
-
98
-
99
-
100
-
101
-
102
-
103
-
104
-
105
-
106
-
107
-
108
-
109
-
110
-
111
-
112
-
113
-
114
-
115
-
116
-
117
-
118
-
119
-
120
-
121
-
122
-
123
-
124
-
125
-
126
-
127
-
128
-
129
-
130
-
131
-
132
-
133
-
134
-
135
-
136
-
137
-
138
-
139
-
140
-
141
-
142
-
143
-
144
-
145
-
146
-
147
-
148
-
149
-
150
-
151
-
152
 |
 |

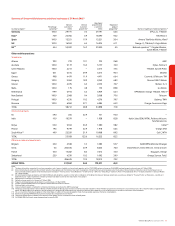
Vodafone Group Plc Annual Report 2006 3
Notes:
(1) Refer to “Non-GAAP Information” on pages 47 to 48 for a reconciliation of this non-GAAP measure to the most comparable GAAP measure and a discussion of this measure.
(2) 2005 net loss includes the cumulative effect of accounting changes related to intangible assets and post employment benefits that increase net loss by £6,372 million or 9.63p per ordinary share. Net loss and shareholders’ equity for 2005, 2004,
2003 and 2002 have been restated to give effect to the modified retrospective adoption of SFAS No. 123 (Revised 2004). See note 38 to the Consolidated Financial Statements for further details on these changes in accounting policy.
(3) 2002 net loss includes the cumulative effect of accounting changes related to derivative financial instruments reducing net loss by £17 million or 0.02p per ordinary share.
(4) Amounts reported refer to continuing operations.
(5) See note 8 to the Consolidated Financial Statements, “(Loss)/earnings per share”. Earnings per American Depository Share (“ADS”) is calculated by multiplying earnings per ordinary share by ten, the number of ordinary shares per ADS. Dividend per
ADS is calculated on the same basis.
(6) The final dividend for the year ended 31 March 2006 was proposed by the directors on 30 May 2006.
(7) For the purposes of calculating these ratios, earnings consist of profit before tax adjusted for fixed charges, dividend income from associated undertakings, share of profits and losses from associated undertakings and profits and losses on ordinary
activities before taxation from discontinued operations. Fixed charges comprise one-third of payments under operating leases, representing the interest element of these payments, interest payable and similar charges and preferred share dividends.
(8) The deficits for the 2002, 2003 and 2004 financial years are presented on the same basis as the Form 20-F for the year ended 31 March 2004. These deficits have not been restated for the effect of discontinued operations, because the UK GAAP
information, which forms the basis of the US GAAP information presented, has not been restated. Even if any such adjustments were made, it is expected that the ratio of earnings to fixed charges would still show a deficit.
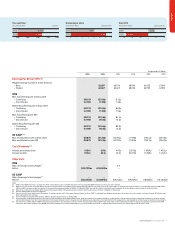
Highlights
At/year ended 31 March
2006 2006 2005 2004 2003 2002
Earnings Per Share (“EPS”)(5)
Weighted average number of shares (millions)
– Basic 62,607 66,196 68,096 68,155 67,961
– Diluted 62,607 66,427 68,096 68,155 67,961
IFRS
Basic (loss)/earnings per ordinary share
– Continuing (48.11)¢ (27.66)p 8.12p
– Discontinued (12.78)¢ (7.35)p 1.56p
Diluted (loss)/earnings per ordinary share
– Continuing (48.11)¢ (27.66)p 8.09p
– Discontinued (12.78)¢ (7.35)p 1.56p
Basic (loss)/earnings per ADS
– Continuing (481.1)¢ (276.6)p 81.2p
– Discontinued (127.8)¢ (73.5)p 15.6p
Diluted (loss)/earnings per ADS
– Continuing (481.1)¢ (276.6)p 80.9p
– Discontinued (127.8)¢ (73.5)p 15.6p
US GAAP(2)(3)
Basic and diluted loss per ordinary share (36.87)¢ (21.20)p (20.77)p (11.90)p (13.31)p (24.67)p
Basic and diluted loss per ADS (368.7)¢ (212.0)p (207.7)p (119.0)p (133.1)p (246.7)p
Cash Dividends(5)(6)
Amount per ordinary share 10.56¢ 6.07p 4.07p 2.0315p 1.6929p 1.4721p
Amount per ADS 105.6¢ 60.7p 40.7p 20.315p 16.929p 14.721p
Other Data
IFRS
Ratio of earnings to fixed charges(7) ––7.0
Deficit $(28,733)m £(16,520)m –
US GAAP
Ratio of earnings to fixed charges(7) ––––––
Deficit(8) $(24,133)m £(13,875)m £(9,756)m £(9,059)m £(8,436)m £(14,425)m
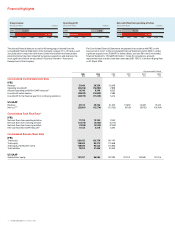
4,000 5,000 6,000 7,000 8,000
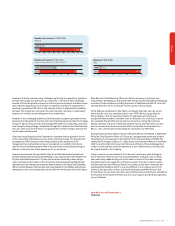
Free cash flow (3)
2005
2006
6,592
Year ended 31 March £ millions
6,418
01234567
Dividends per share
2005
2006
4.07
Year ended 31 March pence per share
6.07
-30 -20 -10 010 20
Basic EPS
2005
2006
8.12
Year ended 31 March pence per share
(27.66)