Vodafone 2006 Annual Report Download - page 132
Download and view the complete annual report
Please find page 132 of the 2006 Vodafone annual report below. You can navigate through the pages in the report by either clicking on the pages listed below, or by using the keyword search tool below to find specific information within the annual report.-
 1
1 -
2
-
3
-
4
-
5
-
6
-
7
-
8
-
9
-
10
-
11
-
12
-
13
-
14
-
15
-
16
-
17
-
18
-
19
-
20
-
21
-
22
-
23
-
24
-
25
-
26
-
27
-
28
-
29
-
30
-
31
-
32
-
33
-
34
-
35
-
36
-
37
-
38
-
39
-
40
-
41
-
42
-
43
-
44
-
45
-
46
-
47
-
48
-
49
-
50
-
51
-
52
-
53
-
54
-
55
-
56
-
57
-
58
-
59
-
60
-
61
-
62
-
63
-
64
-
65
-
66
-
67
-
68
-
69
-
70
-
71
-
72
-
73
-
74
-
75
-
76
-
77
-
78
-
79
-
80
-
81
-
82
-
83
-
84
-
85
-
86
-
87
-
88
-
89
-
90
-
91
-
92
-
93
-
94
-
95
-
96
-
97
-
98
-
99
-
100
-
101
-
102
-
103
-
104
-
105
-
106
-
107
-
108
-
109
-
110
-
111
-
112
-
113
-
114
-
115
-
116
-
117
-
118
-
119
-
120
-
121
-
 122
122 -
 123
123 -
 124
124 -
 125
125 -
 126
126 -
 127
127 -
 128
128 -
 129
129 -
 130
130 -
 131
131 -
 132
132 -
 133
133 -
 134
134 -
 135
135 -
 136
136 -
 137
137 -
 138
138 -
 139
139 -
 140
140 -
 141
141 -
 142
142 -
143
-
144
-
145
-
146
-
147
-
148
-
149
-
150
-
151
-
152
 |
 |

130 Vodafone Group Plc Annual Report 2006
Notes to the Consolidated Financial Statements
continued
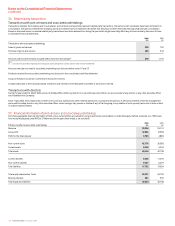
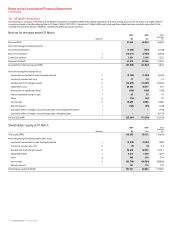
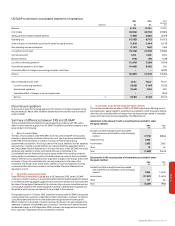
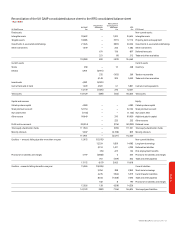
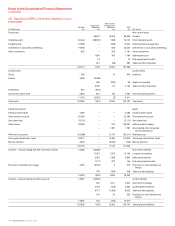
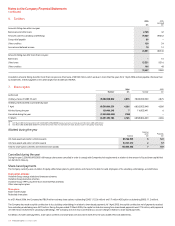
40. Transition to IFRS on first-time adoption continued
31 March 2005 Measurement
Presentation and recognition
UK GAAP differences differences IFRS
UK GAAP format £m £m £m £m IFRS format
Fixed assets: Non-current assets:
68,673 12,326 80,999 Goodwill
Intangible assets 83,464 (68,673) 1,358 16,149 Other intangible assets
Tangible assets 18,398 – (956) 17,442 Property, plant and equipment
Investments in associated undertakings 19,398 – 836 20,234 Investments in associated undertakings
Other investments 852 – 329 1,181 Other investments
1,084 100 1,184 Deferred tax assets
12 – 12 Post employment benefits
613 (28) 585 Trade and other receivables
122,112 1,709 13,965 137,786
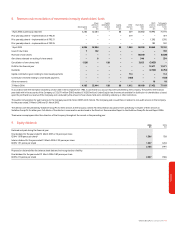
Current assets: Current assets:
Stocks 430 – 10 440 Inventory
Debtors 7,698 (7,698)
268 (230) 38 Taxation recoverable
5,049 115 5,164 Trade and other receivables
Investments 816 (816)
Cash at bank and in hand 2,850 816 103 3,769 Cash and cash equivalents
11,794 (2,381) (2) 9,411
Total assets 133,906 (672) 13,963 147,197 Total assets
Capital and reserves: Equity:
Called up share capital 4,286 – – 4,286 Called up share capital
Share premium account 52,284 – – 52,284 Share premium account
Own shares held (5,121) – – (5,121) Own shares held
Other reserve 99,556 – 525 100,081 Additional paid-in capital
– 1,781 1,781 Accumulated other recognised
income and expense
Profit and loss account (51,688) – 12,177 (39,511) Retained losses
Total equity shareholders’ funds 99,317 – 14,483 113,800 Total equity shareholders’ funds
Minority interests 2,818 – (2,970) (152) Minority Interests
102,135 – 11,513 113,648
Creditors – amounts falling due after more than one year 12,382 (12,382) Non-current liabilities:
11,613 1,577 13,190 Long-term borrowings
3,481 1,368 4,849 Deferred tax liabilities
(171) 307 136 Post employment benefits
Provisions for liabilities and charges 4,552 (4,235) 2 319 Provisions for other liabilities and
charges
797 (359) 438 Trade and other payables
16,934 (897) 2,895 18,932
Creditors – amounts falling due within one year 14,837 (14,837) Current liabilities:
392 1,611 2,003 Short-term borrowings
4,759 (406) 4,353 Current taxation liabilities
9,717 (1,684) 8,033 Trade and other payables
194 34 228 Provisions for other liabilities and
charges
14,837 225 (445) 14,617
133,906 (672) 13,963 147,197 Total equity and liabilities