Vodafone 2006 Annual Report Download - page 40
Download and view the complete annual report
Please find page 40 of the 2006 Vodafone annual report below. You can navigate through the pages in the report by either clicking on the pages listed below, or by using the keyword search tool below to find specific information within the annual report.-
 1
1 -
2
-
3
-
4
-
5
-
6
-
7
-
8
-
9
-
10
-
11
-
12
-
13
-
14
-
15
-
16
-
17
-
18
-
19
-
20
-
21
-
22
-
23
-
24
-
25
-
26
-
27
-
28
-
29
-
 30
30 -
 31
31 -
 32
32 -
 33
33 -
 34
34 -
 35
35 -
 36
36 -
 37
37 -
 38
38 -
 39
39 -
 40
40 -
 41
41 -
 42
42 -
 43
43 -
 44
44 -
 45
45 -
 46
46 -
 47
47 -
 48
48 -
 49
49 -
 50
50 -
51
-
52
-
53
-
54
-
55
-
56
-
57
-
58
-
59
-
60
-
61
-
62
-
63
-
64
-
65
-
66
-
67
-
68
-
69
-
70
-
71
-
72
-
73
-
74
-
75
-
76
-
77
-
78
-
79
-
80
-
81
-
82
-
83
-
84
-
85
-
86
-
87
-
88
-
89
-
90
-
91
-
92
-
93
-
94
-
95
-
96
-
97
-
98
-
99
-
100
-
101
-
102
-
103
-
104
-
105
-
106
-
107
-
108
-
109
-
110
-
111
-
112
-
113
-
114
-
115
-
116
-
117
-
118
-
119
-
120
-
121
-
122
-
123
-
124
-
125
-
126
-
127
-
128
-
129
-
130
-
131
-
132
-
133
-
134
-
135
-
136
-
137
-
138
-
139
-
140
-
141
-
142
-
143
-
144
-
145
-
146
-
147
-
148
-
149
-
150
-
151
-
152
 |
 |

38 Vodafone Group Plc Annual Report 2006
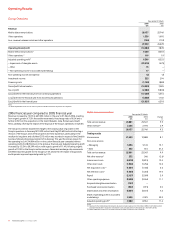
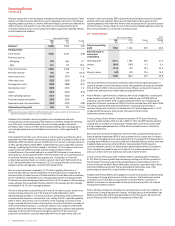
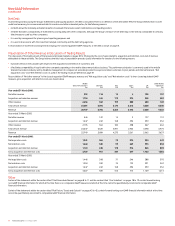
Financial Position and Resources
Balance Sheet Years ended 31 March
2006 2005 Change
£m £m %
Non-current assets
Intangible assets 69,118 97,148 (28.9)
Property, plant and equipment 13,660 17,442 (21.7)
Investments in associated undertakings 23,197 20,234 14.6
Other non-current assets 2,639 2,962 (10.9)
108,614 137,786 (21.2)
Current assets 7,532 9,411 (20.0)
Assets included in disposal group
held for sale 10,592 – –
Total assets 126,738 147,197 (13.9)
Total equity 85,312 113,648 (24.9)
Non-current liabilities
Long-term borrowings 16,750 13,190 27.0
Deferred tax liabilities 5,670 4,849 16.9
Other non-current liabilities 951 893 6.5
23,371 18,932 23.4
Current liabilities
Short-term borrowings 3,448 2,003 72.1
Current taxation liabilities 4,448 4,353 2.2
Other current liabilities 7,616 8,261 (7.8)
15,512 14,617 6.1
Liabilities included in disposal
group held for sale 2,543 – –
Total equity and liabilities 126,738 147,197 (13.9)
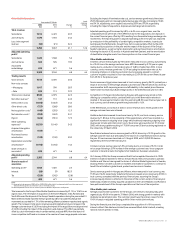
Non-current assets
Intangible assets
At 31 March 2006, the Group’s intangible assets were £69.1 billion, with goodwill
comprising the largest element at £52.6 billion (2005: £81.0 billion). The balance has
decreased from £97.1 billion (£88.1 billion excluding discontinued operations) at
31 March 2005 mainly as a result of a £23.5 billion impairment charge in the 2006
financial year in respect of the carrying value of goodwill of Germany, Italy and Sweden.
Refer to note 10 to the Consolidated Financial Statements for further information on the
impairment losses. Other movements resulted from £4.7 billion of intangible assets
arising on acquisitions in the 2006 financial year, £0.6 billion of additions, primarily in
relation to computer software, £1.0 billion of exchange movements, partially offset by
£1.6 billion of amortisation charges and £0.2 billion of disposals, mainly in relation to
the goodwill related to Vodafone Sweden.
Property, plant and equipment
The most significant component of property, plant and equipment is network
infrastructure, which is fundamental to the Group being able to provide its services.
Property, plant and equipment decreased from £17.4 billion (£12.9 billion excluding
Japan) at 31 March 2005 to £13.7 billion at 31 March 2006 as a result of £3.4 billion of
additions during the year and £0.9 billion of additions arising on acquisition as well as
£0.3 billion of foreign exchange movements, partially offset by £3.1 billion of
depreciation charges and £0.7 billion of disposals including £0.6 billion in relation to the
sale of the Group’s operations in Sweden. At 31 March 2006, network infrastructure
assets of £10.1 billion (2005: £14.1 billion) represented 73.6% (2005: 80.8%) of total
property, plant and equipment.
Investments in associated undertakings
The Group’s investments in associated undertakings increased from £20.2 billion at
31 March 2005 to £23.2 billion at 31 March 2006, mainly as a result of £2.4 billion from
the Group’s share of the results of its associates after the deductions of interest, tax and
minority interest, and favourable exchange rate movements of £1.4 billion, offset by
£0.8 billion of dividends received.
Other non-current assets
Other non-current assets mainly relates to other investments held by the Group, which
totalled £2.1 billion at 31 March 2006 compared to £1.2 billion at 31 March 2005, with
the movement representing an increase in the listed share price of China Mobile in
which the Group has an equity investment and foreign exchange movements, offset by a
£0.5 billion decrease in deferred tax assets, excluding discontinued operations – see
non-current liabilities below.
Current assets
Current assets decreased to £7.5 billion at 31 March 2006 from £9.4 billion at 31 March
2005, mainly as a result of a £1.0 billion reduction in cash and liquid investments and
the reclassification of Vodafone Japan as discontinued operations.
Equity shareholders’ funds
Total equity shareholders’ funds decreased from £113.8 billion at 31 March 2005 to £85.4
billion at 31 March 2006. The decrease comprises of the loss for the year of £21.9 billion,
equity dividends of £2.8 billion, purchases of the Company’s own shares of £6.5 billion, a
loss on the re-issue of treasury shares of £0.1 billion and £0.1 billion of other movements,
partially offset by £0.4 billion of own shares released on vesting of share awards, issue of
new share capital of £0.2 billion, a £0.1 billion share-based payments charge and £2.3
billion of other accumulated other recognised income and expense.
Non-current liabilities
Non-current liabilities increased to £23.4 billion at 31 March 2006 from £18.9 billion at
31 March 2005, mainly due to the increase in borrowings, which is discussed further in
“Liquidity and Capital Resources”. The deferred tax liability increased from £4.8 billion at
31 March 2005 to £5.7 billion at 31 March 2006, which together with the £0.5 billion
decrease in deferred tax assets, arose primarily from a net £0.4 billion in relation to
acquisitions and disposals in the year, £0.6 billion additional tax charges to the income
statement and £0.2 billion of foreign exchange movements – refer to note 6 to the
Consolidated Financial Statements. Non-current liabilities also includes £0.1 billion
(2005: £0.1 billion) in relation to the deficit on defined benefit pension schemes – refer
to note 25 to the Consolidated Financial Statements.
Current liabilities
Current liabilities increased to £15.5 billion from £14.6 billion.
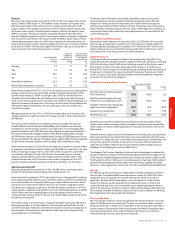
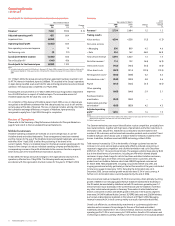
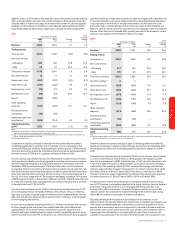
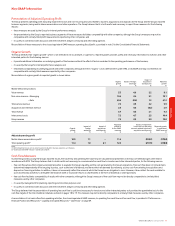
Equity Dividends
The table below sets out the amounts of interim, final and total cash dividends paid or, in
the case of the final dividend for the 2006 financial year, proposed in respect of each
financial year indicated both in pence per ordinary share and translated, solely for
convenience, into cents per ordinary share at the Noon Buying Rate on each of the
respective payment dates for such interim and final dividends.
Year ended Pence per ordinary share Cents per ordinary share
31 March Interim Final Total Interim Final Total
2002 0.7224 0.7497 1.4721 1.0241 1.1422 2.1663
2003 0.7946 0.8983 1.6929 1.2939 1.4445 2.7384
2004 0.9535 1.0780 2.0315 1.7601 1.9899 3.7500
2005 1.91 2.16 4.07 3.60 4.08 7.68
2006 2.20 3.87(1) 6.07 3.83 6.73(1) 10.56
Note:
(1) The final dividend for the year was proposed on 30 May 2006 and is payable on 4 August 2006 to holders of record as of 7
June 2006. This dividend has been translated into US dollars at the Noon Buying Rate at 31 March 2006 for ADS holders,
but will be payable in US dollars under the terms of the deposit agreement.
The Company has historically paid dividends semi-annually, with a regular interim
dividend in respect of the first six months of the financial year payable in February and a
final dividend payable in August. The Board expects that the Company will continue to
pay dividends semi-annually. In November 2005, the Board declared an interim dividend
of 2.20 pence per share, representing a 15.2% increase over last year’s interim dividend.
In considering the level of dividends, the Board takes account of the outlook for earnings
growth, operating cash flow generation, capital expenditure requirements, acquisitions
and divestments, together with the amount of debt and share purchases.
Consistent with this, and developments to the Group’s strategy, the Board has decided to
target a 60% dividend pay out ratio taking effect for the 2006 financial year. The Board is
therefore recommending a final dividend of 3.87 pence, representing a 79.2% increase
over last year’s final dividend and bringing the total dividend for the year to 6.07 pence,
an increase of 49.1% on last year’s total dividend. The dividend pay out ratio, being the
declared interim and proposed final dividends per share as a percentage of adjusted
earnings per share from continuing operations, in respect of the 2006 financial year of
60%, compared favourably with a pay-out ratio for the 2005 financial year of 45%. It is
the intention to grow future dividends on an annual basis in line with underlying
earnings growth, maintaining dividends per share at approximately 60% of adjusted
earnings per share.
Cash dividends, if any, will be paid by the Company in respect of ordinary shares in