Vodafone 2006 Annual Report Download - page 47
Download and view the complete annual report
Please find page 47 of the 2006 Vodafone annual report below. You can navigate through the pages in the report by either clicking on the pages listed below, or by using the keyword search tool below to find specific information within the annual report.-
 1
1 -
2
-
3
-
4
-
5
-
6
-
7
-
8
-
9
-
10
-
11
-
12
-
13
-
14
-
15
-
16
-
17
-
18
-
19
-
20
-
21
-
22
-
23
-
24
-
25
-
26
-
27
-
28
-
29
-
30
-
31
-
32
-
33
-
34
-
35
-
36
-
 37
37 -
 38
38 -
 39
39 -
 40
40 -
 41
41 -
 42
42 -
 43
43 -
 44
44 -
 45
45 -
 46
46 -
 47
47 -
 48
48 -
 49
49 -
 50
50 -
 51
51 -
 52
52 -
 53
53 -
 54
54 -
 55
55 -
 56
56 -
 57
57 -
58
-
59
-
60
-
61
-
62
-
63
-
64
-
65
-
66
-
67
-
68
-
69
-
70
-
71
-
72
-
73
-
74
-
75
-
76
-
77
-
78
-
79
-
80
-
81
-
82
-
83
-
84
-
85
-
86
-
87
-
88
-
89
-
90
-
91
-
92
-
93
-
94
-
95
-
96
-
97
-
98
-
99
-
100
-
101
-
102
-
103
-
104
-
105
-
106
-
107
-
108
-
109
-
110
-
111
-
112
-
113
-
114
-
115
-
116
-
117
-
118
-
119
-
120
-
121
-
122
-
123
-
124
-
125
-
126
-
127
-
128
-
129
-
130
-
131
-
132
-
133
-
134
-
135
-
136
-
137
-
138
-
139
-
140
-
141
-
142
-
143
-
144
-
145
-
146
-
147
-
148
-
149
-
150
-
151
-
152
 |
 |

Vodafone Group Plc Annual Report 2006 45
On 17 March 2006, the Group announced its intention to dispose of its operations in
Japan. As a result, the Group updated its outlook for the 2006 financial year to reflect the
results of Japan being recognised within discontinued operations. There was no
underlying change to the outlook provided on 15 November 2005.
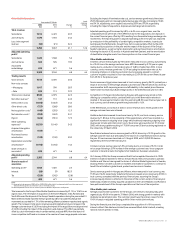
2007 financial year
The Group continues to expect organic growth in proportionate mobile revenue to be in
the range of 5% to 6.5%, lower than the 2006 financial year, reflecting the increasingly
intense competitive environment, continued regulatory reductions in termination rates
and the one off beneficial impact from the introduction of mobile to mobile termination
rates in France in the 2006 financial year.
Proportionate mobile EBITDA margins are expected to be around 1 percentage point
lower than the 2006 financial year on an organic basis, with the impact of pricing
pressures, additional customer investment and changes in termination rates offsetting
initiatives to drive further cost efficiencies, excluding the impact of any one off business
restructuring costs.
Group capitalised fixed asset additions are expected to be in the range of £4.2 billion to
£4.6 billion, which is higher than the 2006 financial year due to the effect of recently
completed acquisitions and disposals and the Group’s rollout of HSDPA.
Free cash flow is expected to be in the range of £4.0 billion to £4.5 billion after an
estimated £1.2 billion of tax payments, including associated interest, in respect of the
potential unfavourable resolution of a number of long standing tax issues. The Group
currently forecasts a further significant increase in cash tax and associated interest
payments in the 2008 financial year, including a potentially material amount related to
the CFC litigation which could be paid should the litigation be resolved unfavourably in
that year.
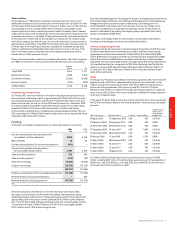
In order to simplify its financial reporting and improve understanding of its results, the
Group will be moving to a single basis of statutory reporting and will no longer provide
proportionate financial information with effect from the 2008 financial year. The Group’s
outlook statement will also change to reflect only statutory financial measures. In
addition, starting with the outlook for the 2008 financial year, the Group will no longer
provide an initial outlook for the following financial year with its interim results in
November. The outlook will only be provided with the preliminary results of the
preceding financial year in May.
The section entitled “Business Overview – Global Services – One Vodafone” on pages 18
to 19 provides additional outlook statements in relation to the expected future benefits
of One Vodafone initiatives on cash flow, capital expenditure and operating expenditure.
Proportionate measures
Proportionate presentation is not a measure recognised under IFRS and is not intended
to replace the full year results prepared in accordance with IFRS. However, since
significant entities in which the Group has an interest are not consolidated,
proportionate information is provided as supplemental data to facilitate a more detailed
understanding and assessment of the full year results prepared in accordance with IFRS.
IFRS requires consolidation of entities which the Group has the power to control and
allows either proportionate consolidation or equity accounting for joint ventures. IFRS
also requires equity accounting for interests in which the Group has significant influence
but not a controlling interest.
The proportionate presentation, below, is a pro rata consolidation, which reflects the
Group’s share of revenue and expenses in entities, both consolidated and
unconsolidated, in which the Group has an ownership interest. Proportionate results are
calculated by multiplying the Group’s ownership interest in each entity by each entity’s
results.
Proportionate presentation of financial information differs in material respects to the
proportionate consolidation adopted by the Group under IFRS for its joint ventures.
Proportionate information includes results from the Group’s equity accounted
investments and other investments. The Group may not have control over the revenue,
expenses or cash flows of these investments and may only be entitled to cash from
dividends received from these entities.
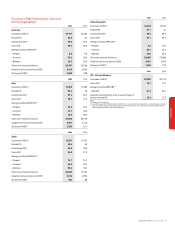
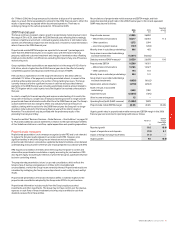
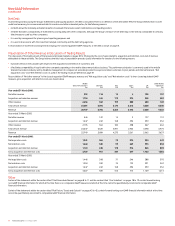
Reconciliations of proportionate mobile revenue and EBITDA margin, and their
respective reported growth rates in the 2006 financial year, to the closest equivalent
GAAP measures are as follows:
Reported
2006 2005 growth
£m £m %
Proportionate revenue 41,355 36,859
– Mobile telecommunications 40,217 36,034 11.6
– Other operations 1,275 1,094
– Less: Inter-segment revenue (137) (269)
Minority share in subsidiary undertakings 666 465
Group share in associated undertakings
and trade investments (12,671) (10,646)
Statutory revenue (GAAP measure) 29,350 26,678 10.0
Proportionate EBITDA 16,380 14,761
– Mobile telecommunications 16,186 14,627
– Other operations 194 134
Minority share in subsidiary undertakings 224 141
Group share in associated undertakings
and trade investments (4,838) (4,162)
Depreciation and amortisation (4,778) (4,367)
Share of results in associated
undertakings 2,428 1,980
Impairment losses (23,515) (475)
Other income and expense 15 –
Operating (loss)/profit (GAAP measure) (14,084) 7,878
Proportionate mobile EBITDA margin 40.2% 40.6% (0.4)%
Organic growth rates in proportionate mobile revenue and EBITDA margin in the 2006
financial year are reconciled to reported growth rates as follows:
EBITDA
Revenue margin
Percentage
% points
Reported growth 11.6 (0.4)
Impact of acquisitions and disposals (1.5) 0.1
Impact of foreign exchange movements (1.1) –
Organic growth 9.0 (0.3)
Performance