Vodafone 2006 Annual Report Download - page 50
Download and view the complete annual report
Please find page 50 of the 2006 Vodafone annual report below. You can navigate through the pages in the report by either clicking on the pages listed below, or by using the keyword search tool below to find specific information within the annual report.-
 1
1 -
2
-
3
-
4
-
5
-
6
-
7
-
8
-
9
-
10
-
11
-
12
-
13
-
14
-
15
-
16
-
17
-
18
-
19
-
20
-
21
-
22
-
23
-
24
-
25
-
26
-
27
-
28
-
29
-
30
-
31
-
32
-
33
-
34
-
35
-
36
-
37
-
38
-
39
-
 40
40 -
 41
41 -
 42
42 -
 43
43 -
 44
44 -
 45
45 -
 46
46 -
 47
47 -
 48
48 -
 49
49 -
 50
50 -
 51
51 -
 52
52 -
 53
53 -
 54
54 -
 55
55 -
 56
56 -
 57
57 -
 58
58 -
 59
59 -
 60
60 -
61
-
62
-
63
-
64
-
65
-
66
-
67
-
68
-
69
-
70
-
71
-
72
-
73
-
74
-
75
-
76
-
77
-
78
-
79
-
80
-
81
-
82
-
83
-
84
-
85
-
86
-
87
-
88
-
89
-
90
-
91
-
92
-
93
-
94
-
95
-
96
-
97
-
98
-
99
-
100
-
101
-
102
-
103
-
104
-
105
-
106
-
107
-
108
-
109
-
110
-
111
-
112
-
113
-
114
-
115
-
116
-
117
-
118
-
119
-
120
-
121
-
122
-
123
-
124
-
125
-
126
-
127
-
128
-
129
-
130
-
131
-
132
-
133
-
134
-
135
-
136
-
137
-
138
-
139
-
140
-
141
-
142
-
143
-
144
-
145
-
146
-
147
-
148
-
149
-
150
-
151
-
152
 |
 |

48 Vodafone Group Plc Annual Report 2006
Non-GAAP Information
continued
Net Debt
In presenting and discussing the Group’s indebtedness and liquidity position, net debt is calculated. There is no definition of net debt within IFRS. The Group believes that it is both
useful and necessary to communicate net debt to investors and other interested parties, for the following reasons:
•net debt allows the Company and external parties to evaluate the Group’s overall indebtedness and liquidity position;
•net debt facilitates comparability of indebtedness and liquidity with other companies, although the Group’s measure of net debt may not be directly comparable to similarly
titled measures used by other companies;
•it is used by management for planning and reporting purposes; and
•it is used in discussions with the investment analyst community and the debt rating agencies.
A reconciliation of short-term and long-term borrowings, the closest equivalent GAAP measures, to net debt is shown on page 41.
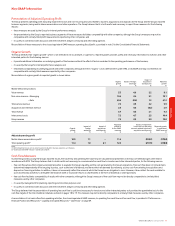
Presentation of Other Revenue in Discussion of Trading Results
The discussion of the trading results of the Group and principal markets on pages 30 to 37 presents the cost of sales related to acquisition and retention costs, net of revenue
attributable to these activities. The Group believes that this basis of presentation provides useful information for investors for the following reasons:
•it provides trends in net subsidies with respect to the acquisition and retention of customers; and
•it facilitates comparability of results with other companies operating in the mobile telecommunications business. This performance indicator is commonly used in the mobile
telecommunications industry and by Vodafone management to compare net subsidies provided to acquire and retain customers to prior periods and internal forecasts. “Net
acquisition costs” and “Net retention costs” as used in the trading results are defined on page 49.
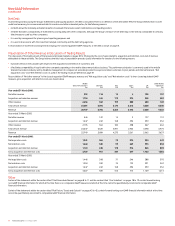
Reconciliation of “Net other revenue” to the closest equivalent GAAP measure, revenue, and “Net acquisition costs” and “Net retention costs” to their closest equivalent GAAP
measure, gross acquisition and retention costs, are shown below:
Mobile Other Mobile
telecommunications Germany Italy Spain UK Operations
£m £m £m £m £m £m
Year ended 31 March 2006:
Net other revenue 532 114 15 6 135 137
Acquisition and retention revenue 1,724 246 178 374 345 583
Other revenue 2,256 360 193 380 480 720
Total service revenue 25,881 5,394 4,170 3,615 4,568 8,530
Revenue 28,137 5,754 4,363 3,995 5,048 9,250
Year ended 31 March 2005:
Net other revenue 546 122 14 2 177 110
Acquisition and retention revenue 1,647 242 168 296 390 554
Other revenue 2,193 364 182 298 567 664
Total service revenue 23,547 5,320 4,091 2,963 4,498 6,973
Revenue 25,740 5,684 4,273 3,261 5,065 7,637
Year ended 31 March 2006:
Net acquisition costs 1,541 366 78 274 380 443
Net retention costs 1,444 349 93 249 395 358
Acquisition and retention revenue 1,724 246 178 374 345 583
Gross acquisition and retention costs 4,709 961 349 897 1,120 1,384
Year ended 31 March 2005:
Net acquisition costs 1,446 348 71 246 388 393
Net retention costs 1,234 330 74 172 391 267
Acquisition and retention revenue 1,647 242 168 296 390 554
Gross acquisition and retention costs 4,327 920 313 714 1,169 1,214
Other
Certain of the statements within the section titled “Chief Executive’s Review” on pages 8 to 11 and the section titled “One Vodafone”, on pages 18 to 19 contain forward-looking
non-GAAP financial information for which at this time there is no comparable GAAP measure and which at this time cannot be quantitatively reconciled to comparable GAAP
financial information.
Certain of the statements within the section titled “Risk Factors, Trends and Outlook” on pages 43 to 45, contain forward-looking non-GAAP financial information which at this time
cannot be quantitatively reconciled to comparable GAAP financial information.