Vodafone 2006 Annual Report Download - page 120
Download and view the complete annual report
Please find page 120 of the 2006 Vodafone annual report below. You can navigate through the pages in the report by either clicking on the pages listed below, or by using the keyword search tool below to find specific information within the annual report.-
 1
1 -
2
-
3
-
4
-
5
-
6
-
7
-
8
-
9
-
10
-
11
-
12
-
13
-
14
-
15
-
16
-
17
-
18
-
19
-
20
-
21
-
22
-
23
-
24
-
25
-
26
-
27
-
28
-
29
-
30
-
31
-
32
-
33
-
34
-
35
-
36
-
37
-
38
-
39
-
40
-
41
-
42
-
43
-
44
-
45
-
46
-
47
-
48
-
49
-
50
-
51
-
52
-
53
-
54
-
55
-
56
-
57
-
58
-
59
-
60
-
61
-
62
-
63
-
64
-
65
-
66
-
67
-
68
-
69
-
70
-
71
-
72
-
73
-
74
-
75
-
76
-
77
-
78
-
79
-
80
-
81
-
82
-
83
-
84
-
85
-
86
-
87
-
88
-
89
-
90
-
91
-
92
-
93
-
94
-
95
-
96
-
97
-
98
-
99
-
100
-
101
-
102
-
103
-
104
-
105
-
106
-
107
-
108
-
109
-
 110
110 -
 111
111 -
 112
112 -
 113
113 -
 114
114 -
 115
115 -
 116
116 -
 117
117 -
 118
118 -
 119
119 -
 120
120 -
 121
121 -
 122
122 -
 123
123 -
 124
124 -
 125
125 -
 126
126 -
 127
127 -
 128
128 -
 129
129 -
 130
130 -
131
-
132
-
133
-
134
-
135
-
136
-
137
-
138
-
139
-
140
-
141
-
142
-
143
-
144
-
145
-
146
-
147
-
148
-
149
-
150
-
151
-
152
 |
 |

118 Vodafone Group Plc Annual Report 2006
Notes to the Consolidated Financial Statements
continued
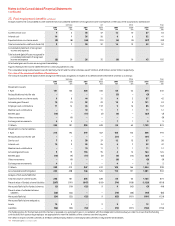
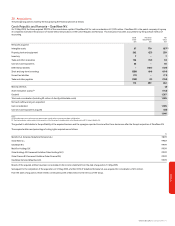
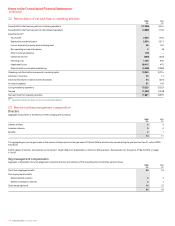
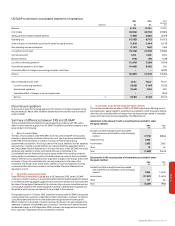
32. Reconciliation of net cash flows to operating activities 2006 2005
£m £m
(Loss)/profit for the financial year from continuing operations (17,233) 5,416
(Loss)/profit for the financial year from discontinued operations (4,588) 1,102
Adjustments for(1):
Tax on profit 2,520 1,433
Depreciation and amortisation 5,834 5,517
Loss on disposal of property, plant and equipment 88 162
Non operating income and expense 2(6)
Other income and expense (15) –
Investment income (353) (303)
Financing costs 1,123 900
Impairment losses 28,415 475
Share of result in associated undertakings (2,428) (1,980)
Operating cash flows before movements in working capital 13,365 12,716
Decrease in inventory 23 17
Decrease/(increase) in trade and other receivables 54 (321)
Increase in payables 81 145
Cash generated by operations 13,523 12,557
Tax paid (1,682) (1,578)
Net cash flows from operating activities 11,841 10,979
Note:
(1) Adjustments include amounts relating to continuing and discontinued operations.
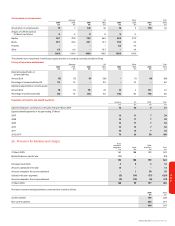
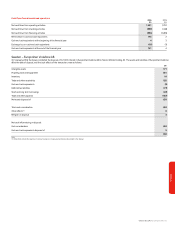
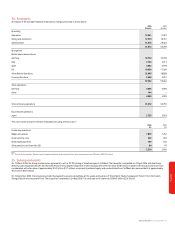
33. Directors and key management compensation
Directors
Aggregate emoluments of the directors of the Company were as follows:
2006 2005
£m £m
Salaries and fees 66
Incentive schemes 54
Benefits 21
13 11
The aggregate gross pre-tax gain made on the exercise of share options in the year ended 31 March 2006 by directors who served during the year was less than £1 million (2005:
£3 million).
Further details of directors’ emoluments can be found in “Board’s Report to Shareholders on Directors’ Remuneration – Remuneration for the year to 31 March 2006” on pages
61 to 69.
Key management compensation
Aggregate compensation for key management, being the directors and members of the Group Executive Committee, were as follows:
2006 2005
£m £m
Short term employee benefits 26 18
Post-employment benefits:
Defined benefit schemes 22
Defined contribution schemes 21
Share-based payments 16 22
46 43