Vodafone 2006 Annual Report Download - page 70
Download and view the complete annual report
Please find page 70 of the 2006 Vodafone annual report below. You can navigate through the pages in the report by either clicking on the pages listed below, or by using the keyword search tool below to find specific information within the annual report.-
 1
1 -
2
-
3
-
4
-
5
-
6
-
7
-
8
-
9
-
10
-
11
-
12
-
13
-
14
-
15
-
16
-
17
-
18
-
19
-
20
-
21
-
22
-
23
-
24
-
25
-
26
-
27
-
28
-
29
-
30
-
31
-
32
-
33
-
34
-
35
-
36
-
37
-
38
-
39
-
40
-
41
-
42
-
43
-
44
-
45
-
46
-
47
-
48
-
49
-
50
-
51
-
52
-
53
-
54
-
55
-
56
-
57
-
58
-
59
-
 60
60 -
 61
61 -
 62
62 -
 63
63 -
 64
64 -
 65
65 -
 66
66 -
 67
67 -
 68
68 -
 69
69 -
 70
70 -
 71
71 -
 72
72 -
 73
73 -
 74
74 -
 75
75 -
 76
76 -
 77
77 -
 78
78 -
 79
79 -
 80
80 -
81
-
82
-
83
-
84
-
85
-
86
-
87
-
88
-
89
-
90
-
91
-
92
-
93
-
94
-
95
-
96
-
97
-
98
-
99
-
100
-
101
-
102
-
103
-
104
-
105
-
106
-
107
-
108
-
109
-
110
-
111
-
112
-
113
-
114
-
115
-
116
-
117
-
118
-
119
-
120
-
121
-
122
-
123
-
124
-
125
-
126
-
127
-
128
-
129
-
130
-
131
-
132
-
133
-
134
-
135
-
136
-
137
-
138
-
139
-
140
-
141
-
142
-
143
-
144
-
145
-
146
-
147
-
148
-
149
-
150
-
151
-
152
 |
 |

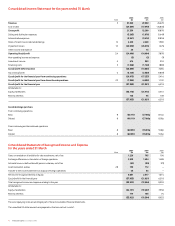
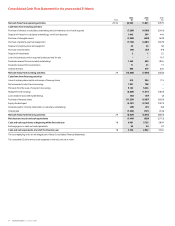
68 Vodafone Group Plc Annual Report 2006
Board’s Report to Shareholders on Directors’ Remuneration
continued
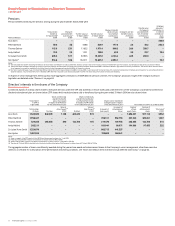
Further details of options outstanding at 31 March 2006 are as follows:
Exercisable: Market price Exercisable: Option price
greater than option price(1) greater than market price(1) Not yet exercisable
Weighted average Latest Weighted average Latest Weighted average Earliest date from
Options held exercise price expiry date Options held exercise price expiry date Options held exercise price which exercisable
Number Pence Number Pence Number Pence
Arun Sarin(2) – – – 6,250,000 236.3 Jul-06 20,166,279 126.5 Jul-06
Peter Bamford – – – 3,307,713 207.2 Mar-07 12,276,305 132.7 Jul-06
Thomas Geitner 3,507,178 97.0 Aug-12 3,259,679 209.3 Jul-11 11,630,103 134.4 Jul-06
Andy Halford 94,444 90.0 Jul-12 344,800 214.6 Jul-11 2,264,849 139.8 Jul-06
Sir Julian Horn-Smith 5,753,505 97.0 Aug-12 3,701,990 201.7 Jul-11 15,745,103 133.1 Jul-06
Ken Hydon – – – 3,098,013 213.9 Jul-06–––
9,355,127 19,962,195 62,082,639
Notes:
(1) Market price is the closing middle market price of the Company’s ordinary shares at 31 March 2006 of 120.5p.
(2) Some of Arun Sarin’s options are in respect of American Depositary Shares, each representing ten ordinary shares in the Company, which are traded on the New York Stock Exchange. The number and option price have been converted into the
equivalent amounts for the Company’s ordinary shares.
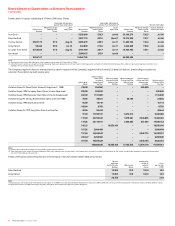
The Company’s register of directors’ interests (which is open to inspection at the Company’s registered office) contains full details of directors’ shareholdings and options to
subscribe. These options by exercise price were:
Options held at
1 April 2005 Options granted Options exercised Options lapsed
or date of during the 2006 during the 2006 during the 2006 Options held at
Option price appointment(1) financial year financial year financial year 31 March 2006
Pence Number Number Number Number Number
Vodafone Group Plc Share Option Scheme (Unapproved – 1988) 155.90 855,000 – – 855,000 –
Vodafone Group 1998 Company Share Option Scheme (Approved) 255.00 502,500–––502,500
Vodafone Group 1998 Executive Share Option Scheme (Unapproved) 282.30 1,131,000–––1,131,000
Vodafone Group Plc Savings Related Share Option Scheme (1988) 70.92 63,521 – 40,185 – 23,336
Vodafone Group 1998 Sharesave Scheme 95.30 16,710–––16,710
108.84 8,705–––8,705
Vodafone Group Plc 1999 Long Term Stock Incentive Plan 90.00 94,444–––94,444
97.00 17,935,197 – 8,674,514 – 9,260,683
119.00 20,794,632 – 1,079,081 2,246,855 17,468,696
119.25 23,119,811 – 2,908,638 831,039 19,380,134
145.25 – 16,836,106 – – 16,836,106
151.56 2,000,400–––2,000,400
157.50 16,943,043 – – 2,342,112 14,600,931
236.34(2) 6,250,000–––6,250,000
291.50 10,369,420 – – 6,543,104 3,826,316
100,084,383 16,836,106 12,702,418 12,818,110 91,399,961
Notes:
(1) Includes options held by Andy Halford as at 26 July 2005 on appointment to the Board
(2) These share options are in respect of American Depositary Shares, each representing ten ordinary shares in the Company, which are traded on the New York Stock Exchange. The number and option price have been converted into the equivalent
amounts for the Company’s ordinary shares.
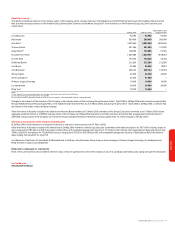
Details of the options exercised by directors of the Company in the year ended 31 March 2006 are as follows:
Options Market price
exercised at date of Gross
during the year Option price exercise pre-tax gain
Number Pence Pence £’000
Peter Bamford 13,395 70.9 152.0 10.9
Andy Halford 13,395 70.9 152.0 10.9
26,790 21.8
Note:
The aggregate gross pre-tax gain made on the exercise of share options in the 2006 financial year by the Company’s above directors was £21,721 (2005: £3,076,276). The closing middle market price of the Company’s shares at 31 March 2006 was 120.5p,
its highest closing price in the 2006 financial year having been 155.0 pence and its lowest closing price having been 109.0 pence.