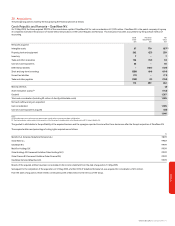
Vodafone 2006 Annual Report Download - page 103
Download and view the complete annual report
Please find page 103 of the 2006 Vodafone annual report below. You can navigate through the pages in the report by either clicking on the pages listed below, or by using the keyword search tool below to find specific information within the annual report.-
 1
1 -
2
-
3
-
4
-
5
-
6
-
7
-
8
-
9
-
10
-
11
-
12
-
13
-
14
-
15
-
16
-
17
-
18
-
19
-
20
-
21
-
22
-
23
-
24
-
25
-
26
-
27
-
28
-
29
-
30
-
31
-
32
-
33
-
34
-
35
-
36
-
37
-
38
-
39
-
40
-
41
-
42
-
43
-
44
-
45
-
46
-
47
-
48
-
49
-
50
-
51
-
52
-
53
-
54
-
55
-
56
-
57
-
58
-
59
-
60
-
61
-
62
-
63
-
64
-
65
-
66
-
67
-
68
-
69
-
70
-
71
-
72
-
73
-
74
-
75
-
76
-
77
-
78
-
79
-
80
-
81
-
82
-
83
-
84
-
85
-
86
-
87
-
88
-
89
-
90
-
91
-
92
-
 93
93 -
 94
94 -
 95
95 -
 96
96 -
 97
97 -
 98
98 -
 99
99 -
 100
100 -
 101
101 -
 102
102 -
 103
103 -
 104
104 -
 105
105 -
 106
106 -
 107
107 -
 108
108 -
 109
109 -
 110
110 -
 111
111 -
 112
112 -
 113
113 -
114
-
115
-
116
-
117
-
118
-
119
-
120
-
121
-
122
-
123
-
124
-
125
-
126
-
127
-
128
-
129
-
130
-
131
-
132
-
133
-
134
-
135
-
136
-
137
-
138
-
139
-
140
-
141
-
142
-
143
-
144
-
145
-
146
-
147
-
148
-
149
-
150
-
151
-
152
 |
 |
Vodafone Group Plc Annual Report 2006 101
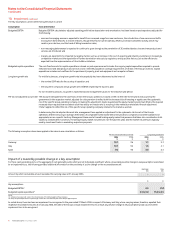
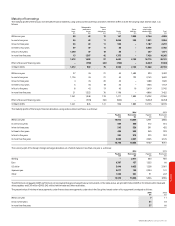
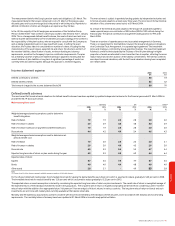
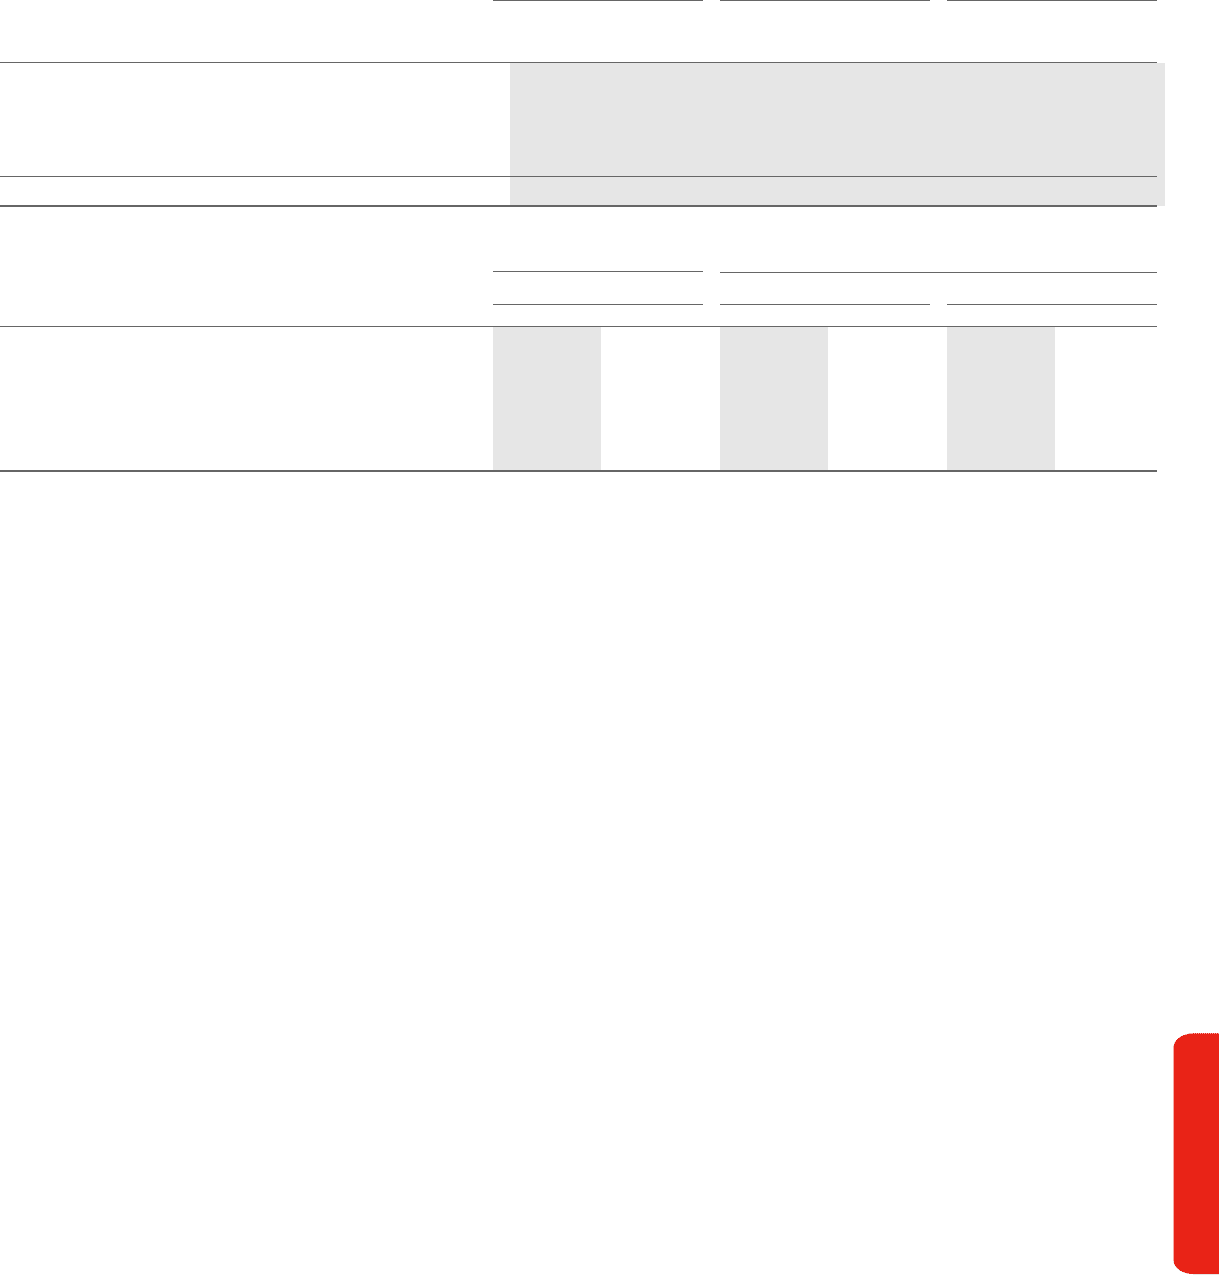
Movements in non-vested shares during the year ended 31 March 2006 is as follows:
All Shares Other Total
Weighted Weighted Weighted
average fair average fair average fair
value at grant value at grant value at grant
Millions date Millions date Millions date
1 April 2005 19 £1.11 103 £1.07 122 £1.08
Granted 19 £1.27 73 £1.22 92 £1.23
Vested (1) £1.12 (16) £1.04 (17) £1.04
Forfeited (2) £1.19 (19) £1.02 (21) £1.04
31 March 2006 35 £1.19 141 £1.16 176 £1.17
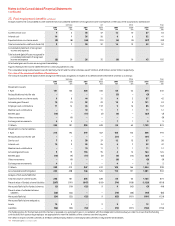
Fair value ADS Options Ordinary Share Options
Board of directors and
Other and Executive Committee Other
2006 2005 2006 2005 2006 2005
Expected life of option (years) 8 – 9 6 – 7 6 – 7 5 – 6 8 – 9 6 – 7
Expected share price volatility 17.9 –18.9% 25.6 – 26.6% 17.6 –18.6% 24.3 – 25.3% 17.9 –18.9% 25.6 – 26.6%
Dividend yield 2.8 – 3.2% 1.7 – 2.1% 2.6 – 3% 1.7 – 2.1 % 2.8 – 3.2% 1.7 – 2.1%
Risk free rates 4.2% 5.1% 4.2% 5.2% 4.2% 5.1%
Exercise price £1.36 £1.40 £1.45 £1.40 £1.36 £1.40
The fair value of the options is estimated at the date of grant using a lattice-based option valuation model (i.e. binomial model) that uses the assumptions noted in the above table.
Lattice-based option valuation models incorporate ranges of assumptions for inputs and those ranges are disclosed above. The executive options have a market based performance
condition attached and hence the assumptions are disclosed separately.
The Group uses historical data to estimate option exercise and employee termination within the valuation model; seperate groups of employees that have similar historical exercise
behaviour are considered separately for valuation purposes. The expected life of options granted is derived from the output of the option valuation model and represents the period
of time that options granted are expected to be outstanding; the range given above results from certain groups of employees exhibiting different behaviour. Expected volatilities are
based on implied volatilities as determined by a simple average of no less than three international banks excluding the highest and lowest numbers. The risk-free rates for periods
within the contractual life of the option are based on the UK gilt yield curve in effect at the time of grant.
Shares used for the Group’s employee incentive plans can be newly issued shares, shares held in treasury or market purchased shares either through the Company's employee
benefit trust or direct from the market or a combination of sources. The source of the shares is determined by the Company having regard to what is considered the most efficient
source at the relevant time.
Some share awards have an attached market condition, based on Total Shareholder Return (“TSR”), which is taken into account when calculating fair value of the share awards. The
valuation methodology for the TSR was based on Vodafone’s ranking within the same group of companies (where possible) over the past 10 years. The volatility of the ranking over
a three year period was used to determine the probability weighted percentage number of shares that could be expected to vest and hence affect fair value.
Other information
The weighted average grant-date fair value of options granted during the year 2006 was £0.30 (2005: £0.34). The total intrinsic value of options exercised during the year ended
31 March 2006 was £164 million (2005: £28 million). The aggregate intrinsic value of fully vested share options outstanding at the year end was £68 million and the aggregate
intrinsic value of fully vested share options exercisable at the year end was £58 million. Cash received from the exercise of options under share options schemes was £356 million
and the tax benefit realised from options exercised during the annual period was £24 million.
The total fair value of shares vested during the year ended 31 March 2006 was £18 million (2005: £5 million).
The compensation cost that has been charged against income in respect of share options and share plans for continuing operations was £109 million (2005: £130 million), which is
comprised entirely of equity-settled transactions. Including discontinued operations, the compensation cost charged against income in respect of share options and share plans in
total was £114 million (2005: £137 million). The total income tax benefit recognised in the consolidated income statement was £50 million (2005: £17 million). Compensation
costs capitalised during the years ended 31 March 2006 and 31 March 2005 were insignificant. As of 31 March 2006, there was £162 million of total compensation cost relating to
non-vested awards not yet recognised, which is expected to be recognised over a weighted average period of two years.
No cash was used to settle equity instruments granted under share-based payment schemes.
The average share price for the financial year was 136 pence.
Financials