Vodafone 2006 Annual Report Download - page 75
Download and view the complete annual report
Please find page 75 of the 2006 Vodafone annual report below. You can navigate through the pages in the report by either clicking on the pages listed below, or by using the keyword search tool below to find specific information within the annual report.-
 1
1 -
2
-
3
-
4
-
5
-
6
-
7
-
8
-
9
-
10
-
11
-
12
-
13
-
14
-
15
-
16
-
17
-
18
-
19
-
20
-
21
-
22
-
23
-
24
-
25
-
26
-
27
-
28
-
29
-
30
-
31
-
32
-
33
-
34
-
35
-
36
-
37
-
38
-
39
-
40
-
41
-
42
-
43
-
44
-
45
-
46
-
47
-
48
-
49
-
50
-
51
-
52
-
53
-
54
-
55
-
56
-
57
-
58
-
59
-
60
-
61
-
62
-
63
-
64
-
 65
65 -
 66
66 -
 67
67 -
 68
68 -
 69
69 -
 70
70 -
 71
71 -
 72
72 -
 73
73 -
 74
74 -
 75
75 -
 76
76 -
 77
77 -
 78
78 -
 79
79 -
 80
80 -
 81
81 -
 82
82 -
 83
83 -
 84
84 -
 85
85 -
86
-
87
-
88
-
89
-
90
-
91
-
92
-
93
-
94
-
95
-
96
-
97
-
98
-
99
-
100
-
101
-
102
-
103
-
104
-
105
-
106
-
107
-
108
-
109
-
110
-
111
-
112
-
113
-
114
-
115
-
116
-
117
-
118
-
119
-
120
-
121
-
122
-
123
-
124
-
125
-
126
-
127
-
128
-
129
-
130
-
131
-
132
-
133
-
134
-
135
-
136
-
137
-
138
-
139
-
140
-
141
-
142
-
143
-
144
-
145
-
146
-
147
-
148
-
149
-
150
-
151
-
152
 |
 |

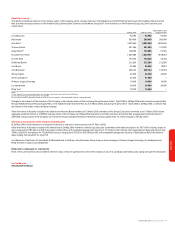
Vodafone Group Plc Annual Report 2006 73
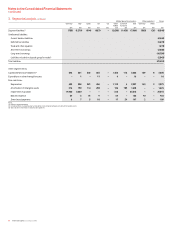
Consolidated Balance Sheet at 31 March
2006 2006 2005
Note $m £m £m
Non-current assets
Goodwill 991,497 52,606 80,999
Other intangible assets 928,719 16,512 16,149
Property, plant and equipment 11 23,759 13,660 17,442
Investments in associated undertakings 14 40,346 23,197 20,234
Other investments 15 3,686 2,119 1,181
Deferred tax assets 6244 140 1,184
Post employment benefits 25 33 19 12
Trade and other receivables 17 628 361 585
188,912 108,614 137,786
Current assets
Inventory 16 517 297 440
Taxation recoverable 14 8 38
Trade and other receivables 17 7,718 4,438 5,164
Cash and cash equivalents 18 4,851 2,789 3,769
13,100 7,532 9,411
Assets included in disposal group held for sale 29 18,423 10,592 –
Total assets 220,435 126,738 147,197
Equity
Called up share capital 19 7,244 4,165 4,286
Share premium account 21 91,216 52,444 52,284
Own shares held 21 (14,259) (8,198) (5,121)
Additional paid-in capital 21 174,194 100,152 100,081
Capital redemption reserve 21 223 128 –
Accumulated other recognised income and expense 22 7,114 4,090 1,781
Retained losses 23 (117,152) (67,356) (39,511)
Total equity shareholders’ funds 148,580 85,425 113,800
Minority interests (197) (113) (152)
Total equity 148,383 85,312 113,648
Non-current liabilities
Long-term borrowings 24 29,133 16,750 13,190
Deferred tax liabilities 69,862 5,670 4,849
Post employment benefits 25 209 120 136
Provisions for liabilities and charges 26 461 265 319
Trade and other payables 27 984 566 438
40,649 23,371 18,932
Current liabilities
Short-term borrowings:
Third parties 24 5,340 3,070 861
Related parties 24 657 378 1,142
Current taxation liabilities 7,736 4,448 4,353
Trade and other payables 27 13,005 7,477 8,033
Provisions for liabilities and charges 26 242 139 228
26,980 15,512 14,617
Liabilities included in disposal group held for sale 29 4,423 2,543 –
Total equity and liabilities 220,435 126,738 147,197
The Consolidated Financial Statements were approved by the Board of directors on 30 May 2006 and were signed on its behalf by:
Arun Sarin Andy Halford
Chief Executive Chief Financial Officer
The accompanying notes are an integral part of these Consolidated Financial Statements. The unaudited US dollar amounts are prepared on the basis set out in note 1.
Financials