Vodafone 2006 Annual Report Download - page 124
Download and view the complete annual report
Please find page 124 of the 2006 Vodafone annual report below. You can navigate through the pages in the report by either clicking on the pages listed below, or by using the keyword search tool below to find specific information within the annual report.-
 1
1 -
2
-
3
-
4
-
5
-
6
-
7
-
8
-
9
-
10
-
11
-
12
-
13
-
14
-
15
-
16
-
17
-
18
-
19
-
20
-
21
-
22
-
23
-
24
-
25
-
26
-
27
-
28
-
29
-
30
-
31
-
32
-
33
-
34
-
35
-
36
-
37
-
38
-
39
-
40
-
41
-
42
-
43
-
44
-
45
-
46
-
47
-
48
-
49
-
50
-
51
-
52
-
53
-
54
-
55
-
56
-
57
-
58
-
59
-
60
-
61
-
62
-
63
-
64
-
65
-
66
-
67
-
68
-
69
-
70
-
71
-
72
-
73
-
74
-
75
-
76
-
77
-
78
-
79
-
80
-
81
-
82
-
83
-
84
-
85
-
86
-
87
-
88
-
89
-
90
-
91
-
92
-
93
-
94
-
95
-
96
-
97
-
98
-
99
-
100
-
101
-
102
-
103
-
104
-
105
-
106
-
107
-
108
-
109
-
110
-
111
-
112
-
113
-
 114
114 -
 115
115 -
 116
116 -
 117
117 -
 118
118 -
 119
119 -
 120
120 -
 121
121 -
 122
122 -
 123
123 -
 124
124 -
 125
125 -
 126
126 -
 127
127 -
 128
128 -
 129
129 -
 130
130 -
 131
131 -
 132
132 -
 133
133 -
 134
134 -
135
-
136
-
137
-
138
-
139
-
140
-
141
-
142
-
143
-
144
-
145
-
146
-
147
-
148
-
149
-
150
-
151
-
152
 |
 |

122 Vodafone Group Plc Annual Report 2006
Notes to the Consolidated Financial Statements
continued
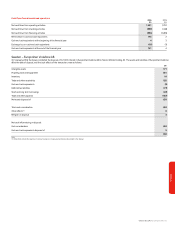
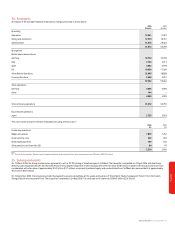
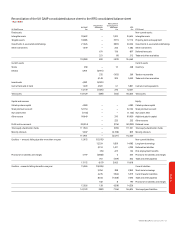
38. US GAAP information
The following is a summary of the effects of the differences between US GAAP and IFRS. The unaudited translation of pounds sterling amounts into US dollars is provided solely for
convenience based on the Noon Buying Rate on 31 March 2006 of $1.7393: £1. Amounts at 31 March 2005 and for the year then ended have been restated to give effect to the
modified retrospective adoption of SFAS No. 123 (Revised 2004), discussed in (j) below.
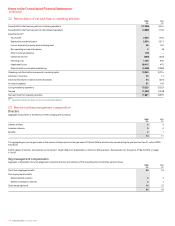
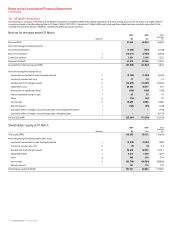
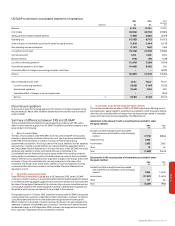
Net loss for the years ended 31 March 2006 2006 2005
Restated
Reference $m £m £m
Revenue (IFRS) 51,048 29,350 26,678
Items (decreasing)/increasing revenues:
Discontinued operations (1,642) (944) (1,108)
Basis of consolidation a(10,011) (5,756) (5,423)
Connection revenue b1,924 1,106 1,223
Revenue (US GAAP) 41,319 23,756 21,370
(Loss)/profit for the financial year (IFRS) (37,953) (21,821) 6,518
Items (increasing)/decreasing net loss:
Investments accounted for under the equity method c (2,139) (1,230) (5,440)
Connection revenue and costs b 17 10 16
Goodwill and other intangible assets d (24,870) (14,299) (15,534)
Impairment losses e26,745 15,377 475
Amortisation of capitalised interest f (188) (108) (105)
Interest capitalised during the year f 63 36 19
Other g(74) (42) 99
Income taxes h15,483 8,902 6,680
Minority interests i(165) (95) (108)
Cumulative effect of change in accounting principle: post employment benefits j ––(195)
Cumulative effect of change in accounting principle: intangible assets j ––(6,177)
Net loss (US GAAP) (23,081) (13,270) (13,752)
Shareholders’ equity at 31 March 2006 2006 2005
Restated
Reference $m £m £m
Total equity (IFRS) 148,383 85,312 113,648
Items (decreasing)/increasing shareholders’ funds:
Investments accounted for under the equity method c (3,978) (2,287) (982)
Connection revenue and costs b (9) (5) (14)
Goodwill and other intangible assets d 56,618 32,552 31,714
Capitalised interest f2,510 1,443 1,529
Other g365 210 104
Income taxes h(52,795) (30,354) (38,856)
Minority interests i197 113 152
Shareholders’ equity (US GAAP) 151,291 86,984 107,295