Vodafone 2006 Annual Report Download - page 4
Download and view the complete annual report
Please find page 4 of the 2006 Vodafone annual report below. You can navigate through the pages in the report by either clicking on the pages listed below, or by using the keyword search tool below to find specific information within the annual report.-
 1
1 -
 2
2 -
 3
3 -
 4
4 -
 5
5 -
 6
6 -
 7
7 -
 8
8 -
 9
9 -
 10
10 -
 11
11 -
 12
12 -
 13
13 -
 14
14 -
 15
15 -
16
-
17
-
18
-
19
-
20
-
21
-
22
-
23
-
24
-
25
-
26
-
27
-
28
-
29
-
30
-
31
-
32
-
33
-
34
-
35
-
36
-
37
-
38
-
39
-
40
-
41
-
42
-
43
-
44
-
45
-
46
-
47
-
48
-
49
-
50
-
51
-
52
-
53
-
54
-
55
-
56
-
57
-
58
-
59
-
60
-
61
-
62
-
63
-
64
-
65
-
66
-
67
-
68
-
69
-
70
-
71
-
72
-
73
-
74
-
75
-
76
-
77
-
78
-
79
-
80
-
81
-
82
-
83
-
84
-
85
-
86
-
87
-
88
-
89
-
90
-
91
-
92
-
93
-
94
-
95
-
96
-
97
-
98
-
99
-
100
-
101
-
102
-
103
-
104
-
105
-
106
-
107
-
108
-
109
-
110
-
111
-
112
-
113
-
114
-
115
-
116
-
117
-
118
-
119
-
120
-
121
-
122
-
123
-
124
-
125
-
126
-
127
-
128
-
129
-
130
-
131
-
132
-
133
-
134
-
135
-
136
-
137
-
138
-
139
-
140
-
141
-
142
-
143
-
144
-
145
-
146
-
147
-
148
-
149
-
150
-
151
-
152
 |
 |

2Vodafone Group Plc Annual Report 2006
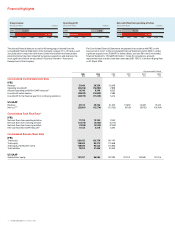
Financial Highlights
At/year ended 31 March
2006 2006 2005 2004 2003 2002
$m £m £m £m £m £m
Consolidated Income Statement Data
IFRS
Revenue 51,048 29,350 26,678
Operating (loss)/profit (24,496) (14,084) 7,878
Adjusted operating profit (Non-GAAP measure)(1) 16,348 9,399 8,353
(Loss)/profit before taxation (25,833) (14,853) 7,285
(Loss)/profit for the financial year from continuing operations (29,973) (17,233) 5,416
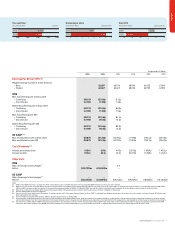
US GAAP
Revenue 41,319 23,756 21,370 19,637 15,487 13,447
Net loss(2)(3) (23,081) (13,270) (13,752) (8,105) (9,072) (16,769)
Consolidated Cash Flow Data(4)
IFRS
Net cash flows from operating activities 17,723 10,190 9,240
Net cash flows from investing activities (11,573) (6,654) (4,112)
Net cash flows from financing activities (7,896) (4,540) (7,242)
Free cash flow (Non-GAAP measure)(1) 11,163 6,418 6,592
Consolidated Balance Sheet Data
IFRS
Total assets 220,435 126,738 147,197
Total equity 148,383 85,312 113,648
Total equity shareholders’ funds 148,580 85,425 113,800
Total liabilities 72,052 41,426 33,549
US GAAP
Shareholders’ equity 151,291 86,984 107,295 129,141 140,580 141,016
The selected financial data set out on the following pages is derived from the
Consolidated Financial Statements of the Company on pages 71 to 130 and as such
should be read in conjunction with them. Certain trends within the financial data
presented below have been impacted by business acquisitions and disposals, the
most significant of which are described in “Business Overview – History and
Development of the Company”.
The Consolidated Financial Statements are prepared in accordance with IFRS, on the
basis set out in note 1 to the Consolidated Financial Statements, which differ in certain
significant respects from US GAAP. For further details, see note 38 to the Consolidated
Financial Statements, “US GAAP information”. Solely for convenience, amounts
represented below in dollars have been translated at $1.7393: £1, the Noon Buying Rate
on 31 March 2006.
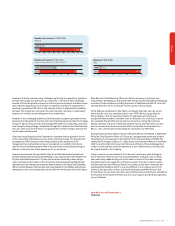
25,000 26,000 27,000 28,000 29,000 30,000
Group revenue
2005
2006
26,678
Year ended 31 March £ millions
29,350
-15,000 -10,000 -5,000 05,000 10,000
Operating profit
2005
2006
7,878
Year ended 31 March £ millions
(14,084)
8,000 8,500 9,000 9,500 10,000 10,500 11,000
Net cash inflow from operating activities
2005
2006
9,240
Year ended 31 March £ millions
10,190