Vodafone 2006 Annual Report Download - page 130
Download and view the complete annual report
Please find page 130 of the 2006 Vodafone annual report below. You can navigate through the pages in the report by either clicking on the pages listed below, or by using the keyword search tool below to find specific information within the annual report.-
 1
1 -
2
-
3
-
4
-
5
-
6
-
7
-
8
-
9
-
10
-
11
-
12
-
13
-
14
-
15
-
16
-
17
-
18
-
19
-
20
-
21
-
22
-
23
-
24
-
25
-
26
-
27
-
28
-
29
-
30
-
31
-
32
-
33
-
34
-
35
-
36
-
37
-
38
-
39
-
40
-
41
-
42
-
43
-
44
-
45
-
46
-
47
-
48
-
49
-
50
-
51
-
52
-
53
-
54
-
55
-
56
-
57
-
58
-
59
-
60
-
61
-
62
-
63
-
64
-
65
-
66
-
67
-
68
-
69
-
70
-
71
-
72
-
73
-
74
-
75
-
76
-
77
-
78
-
79
-
80
-
81
-
82
-
83
-
84
-
85
-
86
-
87
-
88
-
89
-
90
-
91
-
92
-
93
-
94
-
95
-
96
-
97
-
98
-
99
-
100
-
101
-
102
-
103
-
104
-
105
-
106
-
107
-
108
-
109
-
110
-
111
-
112
-
113
-
114
-
115
-
116
-
117
-
118
-
119
-
 120
120 -
 121
121 -
 122
122 -
 123
123 -
 124
124 -
 125
125 -
 126
126 -
 127
127 -
 128
128 -
 129
129 -
 130
130 -
 131
131 -
 132
132 -
 133
133 -
 134
134 -
 135
135 -
 136
136 -
 137
137 -
 138
138 -
 139
139 -
 140
140 -
141
-
142
-
143
-
144
-
145
-
146
-
147
-
148
-
149
-
150
-
151
-
152
 |
 |

128 Vodafone Group Plc Annual Report 2006
Notes to the Consolidated Financial Statements
continued
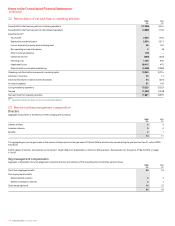
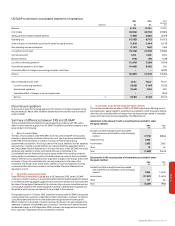
40. Transition to IFRS on first-time adoption continued
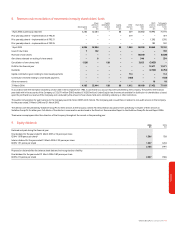
Reconciliation of the UK GAAP consolidated profit and loss account to the IFRS consolidated income statement
Year ended 31 March 2005 Measurement
Presentation and recognition Discontinued
UK GAAP differences differences operations IFRS
UK GAAP format £m £m £m £m £m IFRS format
Turnover 34,133 – (60) (7,395) 26,678 Revenue
Cost of sales (20,753) – (711) 5,664 (15,800) Cost of sales
Gross profit 13,380 – (771) (1,731) 10,878 Gross profit
Selling and distribution costs (2,031) – (15) 397 (1,649) Selling and distribution expenses
Administrative expenses (16,653) 315 12,812 670 (2,856) Administrative expenses
404 1,576 – 1,980 Share of result in associated
undertakings
(315) (160) – (475) Other income and expense
Operating loss (5,304) 404 13,442 (664) 7,878 Operating profit
Share of result in associated undertakings 1,193 (1,193)
Exceptional non-operating items 13 (13)
8 (2) (13) (7) Non-operating income and expense
324 (21) (9) 294 Investment income
Net interest payable and similar items (604) (113) (183) 20 (880) Financing costs
Loss on ordinary activities before taxation (4,702) (583) 13,236 (666) 7,285 Profit before taxation
Tax on loss on ordinary activities (2,236) 538 265 (436) (1,869) Tax on profit
Loss on ordinary activities after taxation (6,938) (45) 13,501 (1,102) 5,416 Profit on ordinary activities after
taxation from continuing operations
– – – 1,102 1,102 Profit on ordinary activites after
taxation from discontinued
operations
(6,938) (45) 13,501 – 6,518 Profit for the financial year
Minority interest (602) 45 449 – (108) Profit for the financial year
attributable to minority interests
Loss for the financial year (7,540) – 13,950 – 6,410 Profit for the financial year
attributable to equity shareholders