Vodafone 2006 Annual Report Download - page 91
Download and view the complete annual report
Please find page 91 of the 2006 Vodafone annual report below. You can navigate through the pages in the report by either clicking on the pages listed below, or by using the keyword search tool below to find specific information within the annual report.-
 1
1 -
2
-
3
-
4
-
5
-
6
-
7
-
8
-
9
-
10
-
11
-
12
-
13
-
14
-
15
-
16
-
17
-
18
-
19
-
20
-
21
-
22
-
23
-
24
-
25
-
26
-
27
-
28
-
29
-
30
-
31
-
32
-
33
-
34
-
35
-
36
-
37
-
38
-
39
-
40
-
41
-
42
-
43
-
44
-
45
-
46
-
47
-
48
-
49
-
50
-
51
-
52
-
53
-
54
-
55
-
56
-
57
-
58
-
59
-
60
-
61
-
62
-
63
-
64
-
65
-
66
-
67
-
68
-
69
-
70
-
71
-
72
-
73
-
74
-
75
-
76
-
77
-
78
-
79
-
80
-
 81
81 -
 82
82 -
 83
83 -
 84
84 -
 85
85 -
 86
86 -
 87
87 -
 88
88 -
 89
89 -
 90
90 -
 91
91 -
 92
92 -
 93
93 -
 94
94 -
 95
95 -
 96
96 -
 97
97 -
 98
98 -
 99
99 -
 100
100 -
 101
101 -
102
-
103
-
104
-
105
-
106
-
107
-
108
-
109
-
110
-
111
-
112
-
113
-
114
-
115
-
116
-
117
-
118
-
119
-
120
-
121
-
122
-
123
-
124
-
125
-
126
-
127
-
128
-
129
-
130
-
131
-
132
-
133
-
134
-
135
-
136
-
137
-
138
-
139
-
140
-
141
-
142
-
143
-
144
-
145
-
146
-
147
-
148
-
149
-
150
-
151
-
152
 |
 |

Vodafone Group Plc Annual Report 2006 89
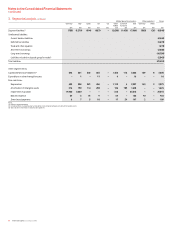
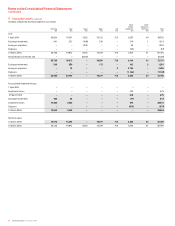
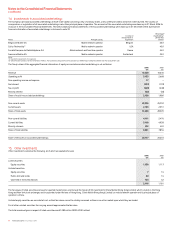
9. Intangible assets Licences and Computer
Goodwill spectrum fees software Other Total
£m £m £m £m £m
Cost:
1 April 2004 78,753 15,178 2,432 – 96,363
Exchange movements 1,519 254 39 (5) 1,807
Arising on acquisition 1,239 229 – 654 2,122
Additions – 126 528 – 654
Disposals (37) – (35) – (72)
31 March 2005 81,474 15,787 2,964 649 100,874
Reclassification as held for sale (8,295) (214) (36) (620) (9,165)
73,179 15,573 2,928 29 91,709
Exchange movements 1,291 216 51 22 1,580
Arising on acquisition 2,802 1,196 20 699 4,717
Additions – 6 616 10 632
Disposals (1,142) – (43) (5) (1,190)
31 March 2006 76,130 16,991 3,572 755 97,448
Accumulated impairment losses and amortisation:
1 April 2004 – 361 1,378 – 1,739
Exchange movements – 12 21 (2) 31
Amortisation charge for the year(1) – 926 494 96 1,516
Impairment losses 475 – – – 475
Disposals – – (35) – (35)
31 March 2005 475 1,299 1,858 94 3,726
Reclassification as held for sale – (8) (7) (90) (105)
475 1,291 1,851 4 3,621
Exchange movements 513 38 33 4 588
Amortisation charge for the year – 1,030 493 102 1,625
Impairment losses 23,515–––23,515
Disposals (979) – (38) (2) (1,019)
31 March 2006 23,524 2,359 2,339 108 28,330
Net book value:
31 March 2006 52,606 14,632 1,233 647 69,118
31 March 2005 80,999 14,488 1,106 555 97,148
Note:
(1) The amortisation charge for the year includes £100 million in relation to discontinued operations
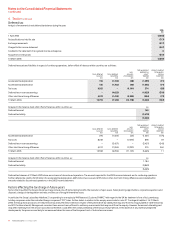
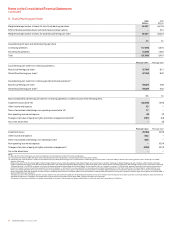
The net book value at 31 March 2006 and expiry dates of the most significant purchased licences, are as follows:
2006
Expiry date £m
Germany December 2020 5,165
UK December 2021 5,245
Financials