Vodafone 2006 Annual Report Download - page 125
Download and view the complete annual report
Please find page 125 of the 2006 Vodafone annual report below. You can navigate through the pages in the report by either clicking on the pages listed below, or by using the keyword search tool below to find specific information within the annual report.-
 1
1 -
2
-
3
-
4
-
5
-
6
-
7
-
8
-
9
-
10
-
11
-
12
-
13
-
14
-
15
-
16
-
17
-
18
-
19
-
20
-
21
-
22
-
23
-
24
-
25
-
26
-
27
-
28
-
29
-
30
-
31
-
32
-
33
-
34
-
35
-
36
-
37
-
38
-
39
-
40
-
41
-
42
-
43
-
44
-
45
-
46
-
47
-
48
-
49
-
50
-
51
-
52
-
53
-
54
-
55
-
56
-
57
-
58
-
59
-
60
-
61
-
62
-
63
-
64
-
65
-
66
-
67
-
68
-
69
-
70
-
71
-
72
-
73
-
74
-
75
-
76
-
77
-
78
-
79
-
80
-
81
-
82
-
83
-
84
-
85
-
86
-
87
-
88
-
89
-
90
-
91
-
92
-
93
-
94
-
95
-
96
-
97
-
98
-
99
-
100
-
101
-
102
-
103
-
104
-
105
-
106
-
107
-
108
-
109
-
110
-
111
-
112
-
113
-
114
-
 115
115 -
 116
116 -
 117
117 -
 118
118 -
 119
119 -
 120
120 -
 121
121 -
 122
122 -
 123
123 -
 124
124 -
 125
125 -
 126
126 -
 127
127 -
 128
128 -
 129
129 -
 130
130 -
 131
131 -
 132
132 -
 133
133 -
 134
134 -
 135
135 -
136
-
137
-
138
-
139
-
140
-
141
-
142
-
143
-
144
-
145
-
146
-
147
-
148
-
149
-
150
-
151
-
152
 |
 |
Vodafone Group Plc Annual Report 2006 123
Financials
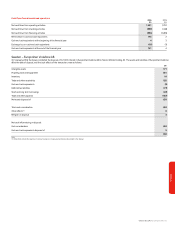
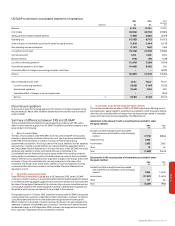
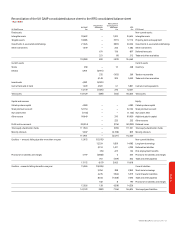
US GAAP condensed consolidated statement of operations 2006 2006 2005
Restated
Reference $m £m £m
Revenue 41,319 23,756 21,370
Cost of sales (48,920) (28,126) (27,803)
Selling, general and administrative expense (7,552) (4,342) (3,779)
Operating loss (15,153) (8,712) (10,212)
Share of results in investments accounted for under the equity method (1,816) (1,044) (2,179)
Non-operating income and expense (1,151) (662) (465)
Loss before income taxes (18,120) (10,418) (12,856)
Income tax benefit 5,614 3,228 4,994
Minority interests (170) (98) (108)
Loss from continuing operations (12,676) (7,288) (7,970)
Discontinued operations, net of taxes (10,405) (5,982) 590
Cumulative effect of changes in accounting principles, net of taxes ––(6,372)
Net loss (23,081) (13,270) (13,752)
Basic and diluted loss per share: Cents Pence Pence
Loss from continuing operations (20.25) (11.64) (12.03)
Discontinued operations (16.62) (9.56) 0.89
Cumulative effect of changes in accounting principles ––(9.63)
Net loss k(36.87) (21.20) (20.77)
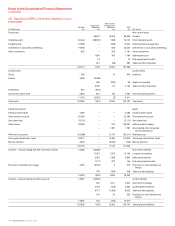
Discontinued operations
As discussed in note 29, the Group disposed of its interests in Vodafone Sweden during
the year ended 31 March 2006. Vodafone Sweden has been classified as discontinued
under US GAAP.
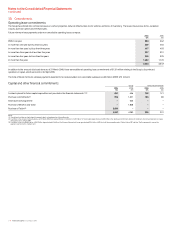
Summary of differences between IFRS and US GAAP
The Consolidated Financial Statements are prepared in accordance with IFRS, which
differ in certain material respects from US GAAP. The differences that are material to the
Group relate to the following:
a. Basis of consolidation
The basis of consolidation under IFRS differs from that under US GAAP. The Group has
interests in several jointly controlled entities, the most significant being Vodafone Italy.
Under IFRS, the Group reports its interests in jointly controlled entities using
proportionate consolidation. The Group’s share of the assets, liabilities, income, expenses
and cash flows of jointly controlled entities are combined with the equivalent items in
the Consolidated Financial Statements on a line-by-line basis. Under US GAAP, the results
and assets and liabilities of jointly controlled entities are incorporated in the
Consolidated Financial Statements using the equity method of accounting. Under the
equity method, investments in jointly controlled entities are carried in the consolidated
balance sheet at cost as adjusted for post-acquisition changes in the Group’s share of the
net assets of the jointly controlled entity, less any impairment in the value of the
investment. The Group’s share of the assets, liabilities, income and expenses of jointly
controlled entities which are included in the Consolidated Financial Statements are
reported in note 13.
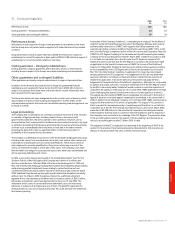
b. Connection revenues and costs
Under IFRS and, for transactions subsequent to 30 September 2003, under US GAAP,
customer connection revenue is recognised together with the related equipment revenue
to the extent that the aggregate equipment and connection revenue does not exceed the
fair value of the equipment delivered to the customer. Any customer connection revenue
not recognised together with related equipment revenue is deferred and recognised over
the period in which services are expected to be provided to the customer.
For transactions prior to 1 October 2003, connection revenue under US GAAP is recognised
over the period that a customer is expected to remain connected to a network. Connection
costs directly attributable to the income deferred are recognised over the same period.
Where connection costs exceed connection revenue, the excess costs were charged in the
statement of operations immediately upon connection. The balances of deferred revenue
and deferred charges as of 30 September 2003 continue to be recognised over the period
that a customer is expected to remain connected to a network.
c. Investments accounted for under the equity method
This line item includes the net effect of IFRS to US GAAP adjustments affecting net loss
and shareholders’ equity related to investments accounted for under the equity method,
other than the cumulative effect of change in accounting principle related to intangible
assets, which has been disclosed separately. The differences are:
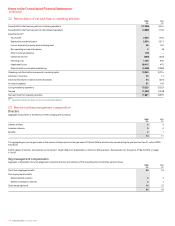
Adjustment to the share of results in investments accounted for under
the equity method 2006 2005
£m £m
Goodwill and other intangible assets associated
with investments accounted for under the equity
method (7,772) (8,864)
Impairment loss 3,600 –
Income taxes 2,863 3,362
Other 79 62
Total (1,230) (5,440)
Adjustments to the carrying value of investments accounted for under
the equity method 2006 2005
£m £m
Goodwill and other intangible assets associated
with investments accounted for under the equity
method 9,539 13,549
Income taxes (11,997) (14,615)
Other 171 84
Total (2,287) (982)