Vodafone 2006 Annual Report Download - page 81
Download and view the complete annual report
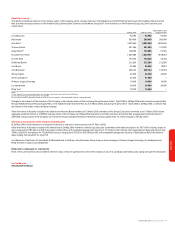
Please find page 81 of the 2006 Vodafone annual report below. You can navigate through the pages in the report by either clicking on the pages listed below, or by using the keyword search tool below to find specific information within the annual report.-
 1
1 -
2
-
3
-
4
-
5
-
6
-
7
-
8
-
9
-
10
-
11
-
12
-
13
-
14
-
15
-
16
-
17
-
18
-
19
-
20
-
21
-
22
-
23
-
24
-
25
-
26
-
27
-
28
-
29
-
30
-
31
-
32
-
33
-
34
-
35
-
36
-
37
-
38
-
39
-
40
-
41
-
42
-
43
-
44
-
45
-
46
-
47
-
48
-
49
-
50
-
51
-
52
-
53
-
54
-
55
-
56
-
57
-
58
-
59
-
60
-
61
-
62
-
63
-
64
-
65
-
66
-
67
-
68
-
69
-
70
-
 71
71 -
 72
72 -
 73
73 -
 74
74 -
 75
75 -
 76
76 -
 77
77 -
 78
78 -
 79
79 -
 80
80 -
 81
81 -
 82
82 -
 83
83 -
 84
84 -
 85
85 -
 86
86 -
 87
87 -
 88
88 -
 89
89 -
 90
90 -
 91
91 -
92
-
93
-
94
-
95
-
96
-
97
-
98
-
99
-
100
-
101
-
102
-
103
-
104
-
105
-
106
-
107
-
108
-
109
-
110
-
111
-
112
-
113
-
114
-
115
-
116
-
117
-
118
-
119
-
120
-
121
-
122
-
123
-
124
-
125
-
126
-
127
-
128
-
129
-
130
-
131
-
132
-
133
-
134
-
135
-
136
-
137
-
138
-
139
-
140
-
141
-
142
-
143
-
144
-
145
-
146
-
147
-
148
-
149
-
150
-
151
-
152
 |
 |

Vodafone Group Plc Annual Report 2006 79
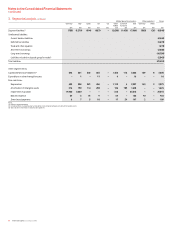
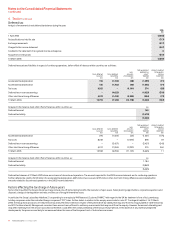
3. Segmental analysis
The Group’s business is principally the supply of mobile telecommunications services and products. Primary segmental information is provided on the basis of geographic regions,
being the basis on which the Group manages its worldwide interests. Other operations primarily comprise fixed line telecommunications businesses. The segmental analysis is
provided for the Group’s continuing operations. Revenue is determined by location of assets, which is not materially different from revenue by location of customer. Inter-segment
sales are charged at arms length prices.
Mobile telecommunications Other operations Group
Germany Italy Spain UK US Other Common Total Germany Other
mobile functions
£m £m £m £m £m £m £m £m £m £m £m
31 March 2006
Service revenue 5,394 4,170 3,615 4,568 – 8,530 26,277 1,320 19 27,616
Equipment and other revenue 360 193 380 480 – 720 2,133 – – 2,133
Segment revenue 5,754 4,363 3,995 5,048 – 9,250 28,410 1,320 19 29,749
Subsidiaries 5,754 – 3,995 5,048 – 7,812 22,609 1,320 – 23,929
Joint ventures –4,363–––1,470 5,833–195,852
Less: intra-segment revenue –––––(32) (32) – – (32)
Common functions 145 145 145
Inter-segment revenue (64) (44) (105) (65) – (121) (19) (418) – – (418)
Net revenue 5,690 4,319 3,890 4,983 – 9,129 126 28,137 1,320 19 29,476
Less: revenue between mobile and other operations (91) ––––(1) (92) (34) – (126)
Group revenue 5,599 4,319 3,890 4,983 – 9,128 126 28,045 1,286 19 29,350
Segment result (17,904) (1,928) 968 698 – 1,296 (16,870) 139 4 (16,727)
Subsidiaries (17,904) – 968 698 – 933 (15,305) 139 – (15,166)
Joint ventures – (1,928) – – – 363 (1,565) – 4 (1,561)
Common functions 215 215 215
Share of result in associated undertakings ––––1,73271282,452–(24) 2,428
Operating (loss)/profit (17,904) (1,928) 968 698 1,732 2,008 223 (14,203) 139 (20) (14,084)
Non-operating income and expense (2)
Investment income 353
Financing costs (1,120)
Loss before taxation (14,853)
Tax on loss (2,380)
Loss for the year from continuing operations (17,233)
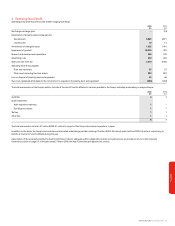
Operating loss (17,904) (1,928) 968 698 1,732 2,008 223 (14,203) 139 (20) (14,084)
Add back:
Impairment losses 19,400 3,600–––515–23,515––23,515
Non-recurring items related to acquisitions and disposals –––––(20) (12) (32) – – (32)
Adjusted operating profit 1,496 1,672 968 698 1,732 2,503 211 9,280 139 (20) 9,399
Non-current assets(1) 24,360 19,422 12,596 8,743 – 17,200 1,907 84,228 754 64 85,046
Investment in associated undertakings ––––17,898 5,182 37 23,117 – 80 23,197
Current assets(1) 669 888 443 743 – 1,555 79 4,377 266 13 4,656
Total segment assets(1) 25,029 20,310 13,039 9,486 17,898 23,937 2,023 111,722 1,020 157 112,899
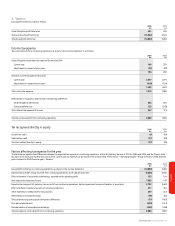
Unallocated non-current assets:
Deferred tax assets 140
Trade and other receivables 231
Unallocated current assets:
Cash and cash equivalents 2,789
Trade and other receivables 79
Taxation recoverable 8
Assets included in disposal group for resale(3) 10,592
Total assets 126,738
Financials