Vodafone 2006 Annual Report Download - page 46
Download and view the complete annual report
Please find page 46 of the 2006 Vodafone annual report below. You can navigate through the pages in the report by either clicking on the pages listed below, or by using the keyword search tool below to find specific information within the annual report.-
 1
1 -
2
-
3
-
4
-
5
-
6
-
7
-
8
-
9
-
10
-
11
-
12
-
13
-
14
-
15
-
16
-
17
-
18
-
19
-
20
-
21
-
22
-
23
-
24
-
25
-
26
-
27
-
28
-
29
-
30
-
31
-
32
-
33
-
34
-
35
-
 36
36 -
 37
37 -
 38
38 -
 39
39 -
 40
40 -
 41
41 -
 42
42 -
 43
43 -
 44
44 -
 45
45 -
 46
46 -
 47
47 -
 48
48 -
 49
49 -
 50
50 -
 51
51 -
 52
52 -
 53
53 -
 54
54 -
 55
55 -
 56
56 -
57
-
58
-
59
-
60
-
61
-
62
-
63
-
64
-
65
-
66
-
67
-
68
-
69
-
70
-
71
-
72
-
73
-
74
-
75
-
76
-
77
-
78
-
79
-
80
-
81
-
82
-
83
-
84
-
85
-
86
-
87
-
88
-
89
-
90
-
91
-
92
-
93
-
94
-
95
-
96
-
97
-
98
-
99
-
100
-
101
-
102
-
103
-
104
-
105
-
106
-
107
-
108
-
109
-
110
-
111
-
112
-
113
-
114
-
115
-
116
-
117
-
118
-
119
-
120
-
121
-
122
-
123
-
124
-
125
-
126
-
127
-
128
-
129
-
130
-
131
-
132
-
133
-
134
-
135
-
136
-
137
-
138
-
139
-
140
-
141
-
142
-
143
-
144
-
145
-
146
-
147
-
148
-
149
-
150
-
151
-
152
 |
 |

44 Vodafone Group Plc Annual Report 2006
Risk Factors, Trends and Outlook
continued
The Group’s business and its ability to retain customers and
attract new customers may be impaired by actual or perceived
health risks associated with the transmission of radiowaves
from mobile telephones, transmitters and associated
equipment.
Concerns have been expressed in some countries where the Group operates that the
electromagnetic signals emitted by mobile telephone handsets and base stations may
pose health risks at exposure levels below existing guideline levels and may interfere
with the operation of electronic equipment. In addition, as described under the heading
“Legal Proceedings” in note 31 to the Consolidated Financial Statements, several mobile
industry participants, including the Company and Verizon Wireless, have had lawsuits
filed against them alleging various health consequences as a result of mobile phone
usage, including brain cancer. While the Company is not aware that such health risks
have been substantiated, there can be no assurance that the actual, or perceived, risks
associated with radiowave transmission will not impair its ability to retain customers and
attract new customers, reduce mobile telecommunications usage or result in further
litigation. In such event, because of the Group’s strategic focus on mobile
telecommunications, its business and results of operations may be more adversely
affected than those of other companies in the telecommunications sector.
Trend Information
The growth in the mobile telecommunications industry in terms of customers, revenue
and cash flows has been substantial over the past decade. Vodafone believes that the
mobile industry will continue to experience growth, although as the markets in which
the Group operates mature, the rate of growth will depend on the demand for enhanced
voice and data products and services and the amount of voice and data traffic moving
from fixed networks to mobile networks. The most significant current trends which are
expected to impact the Group are:
Increasing penetration rates and competition between
network operators for customers
For the Group’s operations which operate in less penetrated markets, the Group expects
customer growth to be the principal source of revenue growth. Gaining new customers
depends on many factors, including network coverage and quality, customer
satisfaction, product offerings and handset range but a key factor is often the pricing of
handsets and tariffs. In general, as penetration rates rise in a market, competition
intensifies as operators invest more in retaining their existing customers whilst offering
incentives to potential new customers. These competitive pressures, along with new
mobile users who generally spend less than existing users, exert a downward pressure on
ARPU and result in increased acquisition and retention costs. The Group anticipates that
this trend will continue, though it will endeavour to offset the impact by usage
stimulation campaigns, new product offerings and leveraging the Group’s scale and
scope.
In markets with high penetration rates, the Group expects usage stimulation and new
products and services to be the main drivers of revenue growth. Building on the success
of recent campaigns in many of the Group’s markets, bundled offerings are expected to
expand to provide better value to customers and encourage increased use of the
Group’s services. Such stimulation initiatives are expected to increase ARPU in the
medium and longer term as higher usage more than offsets the reduced average
revenue per minute or per message. The Group also expects that technology innovation
will lead to the improved integration of PC’s and laptops with mobile services and
provide opportunities for the Group to expand its product offering, resulting in a larger
market for its services.
A number of national regulators are considering allocating additional spectrum or
offering new licences for the provision of mobile telecommunications services. If the
additional spectrum or new licences are acquired by new or existing competitors, the
competitive pressures in the local market may increase.
Impact of new competitors
New service providers, or MVNOs, in a number of markets in which the Group operates
are increasing the competitive pressures in certain market segments with low cost
offerings. Certain national regulators require, or have stated their intention to require,
network operators to provide network access to such service providers. The Group
expects that in markets in which new service providers have a significant competitive
impact, ARPU is likely to reduce and this competition may result in the need for the
Group to invest further amounts in customer retention.
Downward pressure on termination rates from regulatory action
In recent years, action by NRA’s has led to reductions in the income the Group receives
for terminating calls from fixed or other mobile networks and, similarly, reductions in the
cost charged by other operators for connecting a call on their fixed or mobile network.
Vodafone expects such regulatory pressure to persist for the foreseeable future.
Development of and demand for data services
Since the Group’s introduction of data service offerings, revenue from these services has
increased each year, although there can be no assurance that this will continue to be
the case. With continued growth in the use of data services as more customers utilise 3G
services, including video calling and full track music downloads, the Vodafone Mobile
Connect data card, new business focused offerings and the recent launch of 3G
broadband, the Group expects continued growth in non-messaging data service revenue
and for this revenue to increase as a percentage of total service revenue over time.
Benefits of regional scale and scope
As the world’s leading international mobile telecommunications company, the Group is
able to benefit from its regional scale and scope. The One Vodafone initiatives (see
pages 18 to 19) are targeted at maximising the future value of these benefits.
Impact of convergence and disruptive technologies
The emergence of new technologies, which enable core and radio access networks to be
increasingly based on internet protocols, is likely to provide the Group with opportunities
to reduce costs and target the replacement of customers’ fixed line phone services.
However, they will also provide opportunities for new competitors to enter the
telecommunications services market. Vodafone believes it is well placed to take advantage
of these opportunities, as demonstrated by the launch of Vodafone Zuhause in Germany.
Depreciation expense
Depreciation expense is driven largely by capital expenditure on building and upgrading
the Group’s networks. Capital expenditure on network equipment has increased in
recent years with the construction of 3G networks. As network equipment generally has
an expected useful life of between three and ten years, the resulting depreciation
expense in the medium term is likely to be higher than in the current financial year. The
One Vodafone initiatives are expected to reduce capital expenditure, and hence
depreciation, relative to revenue in the longer term.
Seasonality
The Group’s financial results and cash flows have not, historically, been subject to
significant seasonal trends between the first and second half of the financial year,
although there are a number of offsetting trends.
Traditionally, the Christmas period sees a higher volume of customer connections,
contributing to higher equipment and connection revenue in the second half of the
financial year. Ongoing airtime revenue also demonstrates signs of seasonality, with
revenue generally lower during February, which is a shorter than average month, and
revenue from roaming charges higher during the summer months as a result of
increased travel by customers.
There is no assurance that these trends will continue in the future. For additional
considerations related to these trends, please see “Risk Factors” in this section.
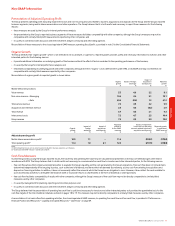
Outlook
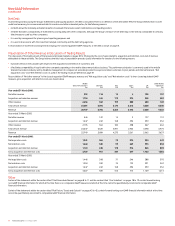
The measures presented in the Group’s outlook have been derived from amounts
calculated in accordance with IFRS but are not themselves IFRS measures. Further
disclosures are provided in “Non-GAAP Information” on pages to 47 to 48 and below for
proportionate measures.
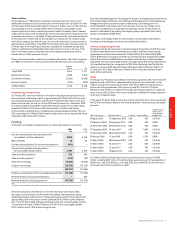
2006 financial year
The following sets out the previously disclosed outlooks provided by the Group in
respect of the 2006 financial year and the Group’s actual performance:
Proportionate Proportionate
mobile revenue mobile EBITDA margin
organic growth(1) organic growth(1)
Outlooks provided for the 2006 financial year:
16 November 2004 High single digit growth Broadly stable
24 May 2005 6% to 9% Flat to 1 percentage
point lower
15 November 2005 Middle of the Lower end of flat to
6% to 9% range 1 percentage point lower
17 March 2006(2) 8% to 9% Higher end of flat to
1 percentage point lower
Actual performance(2) 9.0% 0.3 percentage points lower
Notes:
(1) Assumes constant exchange rates and excludes the impact of business acquisitions and disposals for the financial
measures and adjusted to reflect like-for-like ownership levels in both years.
(2) Excludes discontinued operations.