Vodafone 2006 Annual Report Download - page 33
Download and view the complete annual report
Please find page 33 of the 2006 Vodafone annual report below. You can navigate through the pages in the report by either clicking on the pages listed below, or by using the keyword search tool below to find specific information within the annual report.-
 1
1 -
2
-
3
-
4
-
5
-
6
-
7
-
8
-
9
-
10
-
11
-
12
-
13
-
14
-
15
-
16
-
17
-
18
-
19
-
20
-
21
-
22
-
 23
23 -
 24
24 -
 25
25 -
 26
26 -
 27
27 -
 28
28 -
 29
29 -
 30
30 -
 31
31 -
 32
32 -
 33
33 -
 34
34 -
 35
35 -
 36
36 -
 37
37 -
 38
38 -
 39
39 -
 40
40 -
 41
41 -
 42
42 -
 43
43 -
44
-
45
-
46
-
47
-
48
-
49
-
50
-
51
-
52
-
53
-
54
-
55
-
56
-
57
-
58
-
59
-
60
-
61
-
62
-
63
-
64
-
65
-
66
-
67
-
68
-
69
-
70
-
71
-
72
-
73
-
74
-
75
-
76
-
77
-
78
-
79
-
80
-
81
-
82
-
83
-
84
-
85
-
86
-
87
-
88
-
89
-
90
-
91
-
92
-
93
-
94
-
95
-
96
-
97
-
98
-
99
-
100
-
101
-
102
-
103
-
104
-
105
-
106
-
107
-
108
-
109
-
110
-
111
-
112
-
113
-
114
-
115
-
116
-
117
-
118
-
119
-
120
-
121
-
122
-
123
-
124
-
125
-
126
-
127
-
128
-
129
-
130
-
131
-
132
-
133
-
134
-
135
-
136
-
137
-
138
-
139
-
140
-
141
-
142
-
143
-
144
-
145
-
146
-
147
-
148
-
149
-
150
-
151
-
152
 |
 |

Vodafone Group Plc Annual Report 2006 31
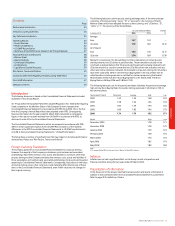
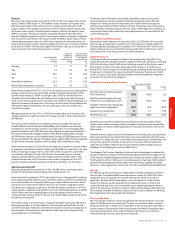
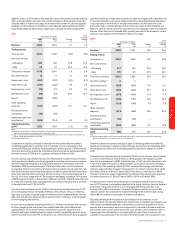
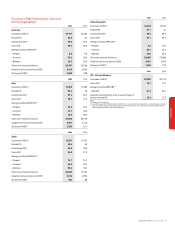
Revenue
Revenue in the mobile business increased by 9.3%, or 6.7% on an organic basis, for the
year to 31 March 2006 due to a 7.2% increase in service revenue on an organic basis
offset by lower growth in other revenue. Service revenue growth reflected a 15.2%
organic increase in the average customer base of the controlled mobile networks and
the Group’s share of jointly controlled mobile networks, offset by the impact of lower
ARPU in a number of the Group’s markets. Competitive pressures have intensified
recently following a significant number of new market entrants and greater competition
from incumbents, specifically in the mature markets of Western Europe. Many of these
markets have penetration rates over 100% which, together with termination rate cuts
and a higher proportion of lower spending prepaid customers across the Group, have led
to the decline in ARPU. The estimated impact of termination rate cuts on the growth in
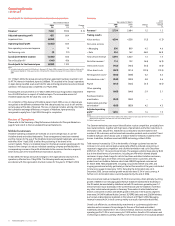
service revenue in the current financial year is as follows:
Impact of Service revenue
termination growth excluding
Reported growth rate cut on the impact of
in service service revenue termination rate
revenue growth cuts
%%%
Germany 1.4 1.7 3.1
Italy 1.9 3.4 5.3
Spain 22.0 2.9 24.9
UK 1.6 1.6 3.2
Other Mobile Operations 22.3 2.7 25.0
Mobile telecommunications business 9.9 2.4 12.3
Voice revenue increased by 8.1%, or by 5.3% on an organic basis, due to by the growth in
average customers and a successful usage stimulation programme leading to 24.6%
growth in total minutes, or 18.9% on an organic basis, offset by tariff declines from
competition and termination rate cuts. Revenue from outgoing calls was the primary
driver of voice revenue growth, whilst incoming voice revenue increased marginally as a
significant increase in the proportion of incoming calls from other mobile networks was
offset by the impact of termination rate cuts, particularly in the second half of the
current financial year.
Messaging revenue rose by 13.1%, or 10.6% on an organic basis, as an increase in the
average customer base and the number of messages sent per customer was offset by
tariff declines.
The success of 3G, Vodafone live! and offerings in the business segment, including
Vodafone Mobile Connect data cards and BlackBerry from Vodafone, were the main
contributors to a 61.2% increase, or 60.4% on an organic basis, in non-messaging data
revenue. An additional 6,321,000 3G devices were registered on the Group’s networks in
the current financial year, bringing the total to 7,721,000 at 31 March 2006, including
660,000 business devices such as Vodafone Mobile Connect 3G/GPRS data cards. Prior to
the announcement of the disposal of Vodafone Japan in March 2006, the Group registered
its ten millionth consumer 3G device, when including 100% of the devices in Italy.
Other revenue increased to £2,256 million, principally due to growth in revenue related
to acquisition and retention activities in Spain, partially offset by a reduction in net other
revenue, resulting principally from to a fall in the number of customers connected to
non-Vodafone networks in the UK. A 32.5% rise in the number of gross customer
additions, partially offset by a fall in the average revenue for handset sales to new
prepaid customers and a 24.3% increase in the number of upgrades, led to a 4.7%
growth in revenue related to acquisition and retention activities to £1,724 million.
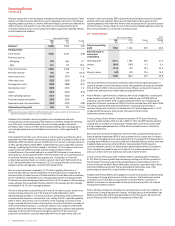
Adjusted operating profit
Adjusted operating profit increased by 11.4% to £9,280 million, comprising organic
growth of 10.3% and favourable exchange rate movements of 1.1%.
Interconnect costs increased by 7.2% on an organic basis, as strong growth in outgoing
voice usage was partially offset by cuts in termination rates in a number of markets and
an increased proportion of outgoing traffic being to other Vodafone customers, which
does not result in interconnect expense. The rise in the number of upgrades and the
increased cost of upgrading customers to 3G were the primary contributors to an 9.4%
organic growth in acquisition and retention costs, net of attributable revenue, to £2,985
million. Payroll and other operating expenses as a percentage of service revenue
continued to fall, reaching 22.2% for the year to 31 March 2006 compared to 22.4% for
the previous financial year.
The charge relating to the amortisation of acquired intangible assets was £157 million
following acquisitions in the Czech Republic, India, Romania and South Africa in the
current financial year. Depreciation and other amortisation increased, principally due to
the net impact of the acquisitions and disposal in the current financial year and the
ongoing expansion of 3G networks.
Performance
The Group’s share of the result in associated undertakings, before non-recurring
amounts related to business acquisitions and disposals, grew by 20.2% after the
deduction of interest, tax and minority interest, and 16.8% before the deductions,
primarily due to growth at Verizon Wireless in the US. The Group’s share of the result in
Verizon Wireless increased by 25.5% to £2,112 million, before deduction of interest, tax
and minority interest, with a particularly strong performance in the second half of the
current financial year.
Non-mobile telecommunications
Revenue from Other Operations increased by 22.3% to £1,339 million for the current
financial year, principally due to growth in Arcor, the Group’s non-mobile operation in
Germany. Adjusted operating profit increased to £119 million from £19 million in the
previous financial year as a result of the revenue growth and cost efficiencies in Arcor
and a reduced loss in the Group’s other non-mobile operations.
Impairment losses
The Group recorded an impairment charge to the carrying value of goodwill in the
current financial year of £23,515 million in respect of the Group’s operations in Germany
(£19,400 million) and Italy (£3,600 million) reflecting a revision of the Group’s view of
the prospects for these businesses, particularly in the medium to long term, and a
further £515 million in respect of the Swedish business following the announcement of
its disposal. An impairment loss was recognised in the previous financial year of £475
million in respect of the Group’s Swedish operations and reflected fierce competition
along with onerous 3G licence obligations.
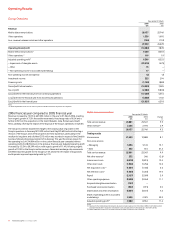
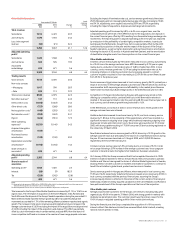
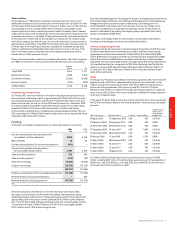
Investment income and financing costs Years ended 31 March
2006 2005 Change
£m £m %
Net financing costs before dividends
from investments (318) (293) 8.5
Potential interest charges arising on
settlement of outstanding tax issues (329) (245) 34.3
Changes in the fair value of equity put
rights and similar arrangements (161) (67) 140.3
Dividends from investments 41 19 115.8
Net financing costs (767) (586) 30.9
Net financing costs before dividends from investments increased by 8.5% to £318
million as an increase in average net debt compared to the previous year was partially
offset by gains on mark-to-market adjustments on financial instruments in the current
financial year.
Potential interest charges arising on the settlement of outstanding tax issues represents
the Group’s estimate of any interest that may be due to tax authorities when the issues
are settled. This charge varies due to the interest rates applied by the tax authorities, the
timing of tax payments and status of discussions on tax issues with the relevant tax
authorities. At 31 March 2006, the provision for potential interest charges arising on
settlement of outstanding tax issues was £896 million.
The change in the fair value of equity put rights and similar arrangements comprises the
fair value movement in relation to the potential put rights held by Telecom Egypt over its
25.5% interest in Vodafone Egypt and the fair value of a financial liability in relation to the
minority partners of Arcor, the Group’s non-mobile operation in Germany. Further details in
respect of these arrangements are provided in the section titled “Liquidity and Capital
Resources – Option agreements” and in note 24 to the Consolidated Financial Statements.
Taxation
The effective tax rate for the year to 31 March 2006 is (16.0)% compared to 25.7% for
the prior year. The negative effective tax rate arises as a result of the £23,515 million
impairment losses recognised in the current financial year. These losses are not
expected to be deductible for tax purposes so are not expected to create a future
benefit. The effective tax rate, exclusive of the impairment losses, is 27.5% for the
current financial year, which is lower than the Group’s weighted average tax rate as a
result of the repurchase of shares in Vodafone Italy and favourable tax settlements, but
has increased compared to the previous year as the prior year benefited from finalising
the reorganisation of the Group’s German operations.
Basic loss per share
Basic earnings per share from continuing operations fell from 8.12 pence to a loss per
share of 27.66 pence for the current year. The basic loss per share is after a charge of
37.56 pence per share in relation to an impairment of the carrying value of goodwill, a
further charge of 0.26 pence per share for the change in fair value of equity put rights
and similar arrangements, and a credit of 0.05 pence per share for non-recurring
amounts relating to business acquisitions and disposals.