Vodafone 2006 Annual Report Download - page 131
Download and view the complete annual report
Please find page 131 of the 2006 Vodafone annual report below. You can navigate through the pages in the report by either clicking on the pages listed below, or by using the keyword search tool below to find specific information within the annual report.-
 1
1 -
2
-
3
-
4
-
5
-
6
-
7
-
8
-
9
-
10
-
11
-
12
-
13
-
14
-
15
-
16
-
17
-
18
-
19
-
20
-
21
-
22
-
23
-
24
-
25
-
26
-
27
-
28
-
29
-
30
-
31
-
32
-
33
-
34
-
35
-
36
-
37
-
38
-
39
-
40
-
41
-
42
-
43
-
44
-
45
-
46
-
47
-
48
-
49
-
50
-
51
-
52
-
53
-
54
-
55
-
56
-
57
-
58
-
59
-
60
-
61
-
62
-
63
-
64
-
65
-
66
-
67
-
68
-
69
-
70
-
71
-
72
-
73
-
74
-
75
-
76
-
77
-
78
-
79
-
80
-
81
-
82
-
83
-
84
-
85
-
86
-
87
-
88
-
89
-
90
-
91
-
92
-
93
-
94
-
95
-
96
-
97
-
98
-
99
-
100
-
101
-
102
-
103
-
104
-
105
-
106
-
107
-
108
-
109
-
110
-
111
-
112
-
113
-
114
-
115
-
116
-
117
-
118
-
119
-
120
-
 121
121 -
 122
122 -
 123
123 -
 124
124 -
 125
125 -
 126
126 -
 127
127 -
 128
128 -
 129
129 -
 130
130 -
 131
131 -
 132
132 -
 133
133 -
 134
134 -
 135
135 -
 136
136 -
 137
137 -
 138
138 -
 139
139 -
 140
140 -
 141
141 -
142
-
143
-
144
-
145
-
146
-
147
-
148
-
149
-
150
-
151
-
152
 |
 |

Vodafone Group Plc Annual Report 2006 129
Financials
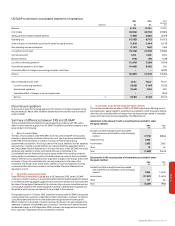
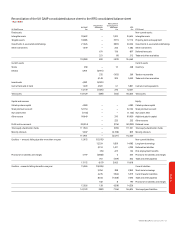
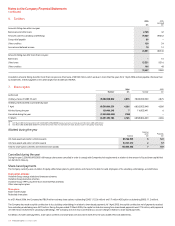
Reconciliation of the UK GAAP consolidated balance sheet to the IFRS consolidated balance sheet
1 April 2004 Measurement
Presentation and recognition
UK GAAP differences differences IFRS
UK GAAP format £m £m £m £m IFRS format
Fixed assets: Non-current assets:
Intangible assets 93,622 – 1,002 94,624 Intangible assets
Tangible assets 18,083 – (971) 17,112 Property, plant and equipment
Investments in associated undertakings 21,226 – (800) 20,426 Investments in associated undertakings
Other investments 1,049 – 233 1,282 Other investments
671 136 807 Deferred tax assets
221 (9) 212 Trade and other receivables
133,980 892 (409) 134,463
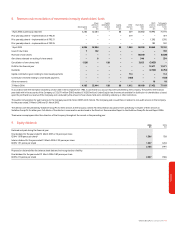
Current assets: Current assets:
Stocks 458 – 10 468 Inventory
Debtors 6,901 (6,901)
372 (103) 269 Taxation recoverable
5,148 305 5,453 Trade and other receivables
Investments 4,381 (4,381)
Cash at bank and in hand 1,409 4,381 61 5,851 Cash and cash equivalents
13,149 (1,381) 273 12,041
Total assets 147,129 (489) (136) 146,504 Total assets
Capital and reserves: Equity:
Called up share capital 4,280 – – 4,280 Called up share capital
Share premium account 52,154 – – 52,154 Share premium account
Own shares held (1,136) – – (1,136) Own shares held
Other reserve 99,640 – 310 99,950 Additional paid-in capital
– 233 233 Other reserves
Profit and loss account (43,014) – (916) (43,930) Retained losses
Total equity shareholders’ funds 111,924 – (373) 111,551 Total equity shareholders’ funds
Minority interests 3,007 – (2,198) 809 Minority interests
114,931 – (2,571) 112,360
Creditors – amounts falling due after more than one year 12,975 (12,975) Non-current liabilities:
12,224 1,859 14,083 Long-term borrowings
3,314 1,421 4,735 Deferred tax liabilities
(73) 227 154 Post employment benefits
Provisions for liabilities and charges 4,197 (3,858) 5 344 Provisions for liabilities and charges
751 (449) 302 Trade and other payables
17,172 (617) 3,063 19,618
Creditors – amounts falling due within one year 15,026 (15,026) Current liabilities:
2,054 788 2,842 Short-term borrowings
4,275 (356) 3,919 Current taxation liabilities
8,643 (1,068) 7,575 Trade and other payables
182 8 190 Provisions for liabilities and charges
15,026 128 (628) 14,526
147,129 (489) (136) 146,504 Total equity and liabilities